Download
1 / 84
940 likes | 1.44k Views
12 Lead EKG 101. A Basic Overview of How to Interpret 12 Lead EKGs and Treat a Cardiac Patient. Region IV Pre-Hospital Systems Coordination Committee. Purpose:.

E N D
12 Lead EKG 101 A Basic Overview of How to Interpret 12 Lead EKGs and Treat a Cardiac Patient Region IV Pre-Hospital Systems Coordination Committee
Purpose: The purpose of this course is to provide pre-hospital clinicians with the tools necessary to identify the basic A&P of the heart, interpret 12 Lead EKGs, localize and treat AMIs as well as recognize imposters and potential complications.
Basic Cardiac Anatomy & Physiology • Muscular pump about the size of your fist • primary function is to pump oxygenated blood to the rest of the body. • Made up of four chambers, • right and left atria • right and left ventricles • The septum is a thin muscular wall that separates the right and left sides of the heart. • Each contraction of the heart occurs in response to an electrical impulse that starts in the upper portion of the heart. • Blood is moved in a closed circuit through the body by the pumping of the heart.
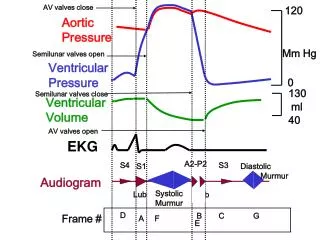
Basic Cardiac Anatomy & Physiology • The heart contracts and pumps blood out to the body (systole) and relaxes to fill with more blood (diastole). • The heart muscle itself is like all other organs in the body and requires oxygen to function. • The oxygen-rich blood is circulated to the heart muscle through the coronary arteries. • There are two main arteries: • Right coronary artery • Left main coronary artery • both start at the aorta • These vessels then branch off into smaller and smaller vessels along the surface of the heart.
In order to perform work, the heart needs oxygen and nutrients. • There are two main arteries: • Right coronary artery (RCA) • Left coronary artery (LCA). • The left coronary artery divides into: • Left anterior descending (LAD) branch • Left circumflex branch(LCX) • The right coronary artery and the branches of the left coronary artery provide numerous smaller branches which penetrate the heart muscle, supplying it with blood. • Both coronary arteries originate from the aorta and run along the surface of the heart. • In the majority of human hearts, coronary circulation follows a predictable pattern.
Left Main Coronary Artery • Branches quickly into the LAD & LCX. Involves almost 2/3 of the heart muscle • Right Coronary Artery (RCA)The RCA supplies blood to the bottom (inferior) portion and part of the back (posterior) portion of the left ventricle. The posterior portion of the septum is also supplied with blood from the RCA. • SA Node 55% • AV Node 90% • AV Blocks • Left Anterior Descending Branch (LAD)The LAD supplies blood to the front (anterior) portion of the left ventricle, apical including most of the anterior portion of the septum separating the ventricles. • Bundle Branch Block, AMI, CHF • Left Circumflux Branch (LCX)The LCX supplies blood to the left side (lateral) portion and the back (posterior) portion of the left ventricle. • SA Node 45% • AV Node 10% • Lateral & posterior MI
Sino-Atrial (SA) Node: natural cardiac pacemaker. The heartbeat starts here and spreads throughout the network of conduction fibers in the two atria causing them to contract. • Normally, the heartbeat can only reach the ventricles (the two lower chambers), after it has passed through the atrioventricular (AV) node. • Atrioventricular (AV) Node: slows down the electrical signal so that the atrial contractions can finish filling the ventricles completely. The AV node also prevents the lower chambers from beating too fast if the atria develops a fast rhythm (tachyarrhythmia). • His Bundle, bundle branches, and the Purkinje system : The electrical signal finally passes to the ventricles causing the ventricles to contract
Anatomy of an EKG The EKG, or a measure of this electrical activity of the heart, is comprised of 3 primary parts... 1. P wave---electrical depolarization of the atria...contraction follows... 2. QRS COMPLEX---electrical depolarization of the ventricles...contraction follows... 3. T wave---electrical repolarization of the ventricles...and thus, relaxation...
P wave: Represents positive and negative deflections of atrial contraction and relaxation • PR Interval: Distance between the P wave and the R wave. Should be consistent • QRS Complex • Q wave: First negative deflection • Normal in I, aVL, V1, V6 • Significant or pathologic is one box wide and/or 1/3 the height of the R wave • R Wave: First positive deflection • S Wave: Next negative deflection
ST Segment: Essentially isoelectric, slopes gentely upward J point: the point at which the ST Segment takes off from the QRS complex T Wave: Upright always in leads I, II, V2-V6. aVR is always negative. Leads III, aVL, aVF, and V1 can be positive or negative U Wave: Seen best in V3, same polarity as T wave, sign of hypokalemia QT Interval: One complete ventricular cycle. None are > ½ the preceding R-R
Einthoven’s Triangle Lead I - + extends from the right to the left arm - Lead III extends from the left arm to the left foot Lead II extends from the right arm to the left foot +
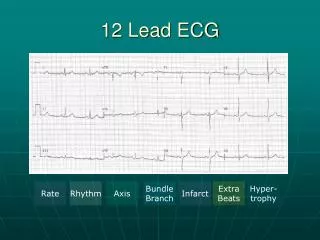
Anatomy of a 12-Lead EKG This is an example a 12-lead EKG.
Anatomy of a 12-Lead EKG (cont.) • At the bottom of this 12-lead are rhythm strips (highlighted). • Any of the 12-leads can be shown as rhythm strips. • You can configure the device to show you any of the six limb leads on the rhythm strip (I, II, III, aVR, aVL or aVF).
Anatomy of a 12 Lead EKG (cont.) The format of the 12-lead EKG is very standard. While there are a few exceptions, the format you see here is typical of what you will see in most 12-lead EKGs done in North America.
Anatomy of a 12-Lead EKG (cont.) • The 12-lead can provide a computer generated interpretation. • When you see “ACUTE MI SUSPECTED” the machine is right about 98% of the time. • In order to attain specificity, if the computer isn’t absolutely sure that an AMI is present, it will not say anything about it. • In other words YOU are the primary interpreter, the computer is your backup.
Anatomy of a 12-Lead EKG (cont.) • The 12-Lead is very good at measuring intervals and durations. • It is better at measuring the PR-interval and the QRS width. • We express these intervals and durations in seconds • 12-lead expresses them in milliseconds. It is simple to convert milliseconds to seconds.
Anatomy of a 12-Lead EKG (cont.) • When you use an EKG to determine the cardiac rate and rhythm, certain sampling time is required. • 12-lead interpretation: Only one beat from each lead is needed to make an interpretation.
Anatomy of a 12-Lead EKG (cont.) • There are six positive electrodes on the chest, yielding six leads. • There are four electrodes on the limbs from which the EKG machine makes another six leads. • Each lead has one positive electrode. • Positive electrode is a camera. • view is from the positive electrode toward the negative electrode. • The portion of the left ventricle that each leads “sees” is determined by the location of that positive electrode. • Different placements of the electrodes will yield different viewpoints.
Anatomy of a 12-Lead EKG (cont.) I aVR V1 V4 II aVL V2 V5 III aVF V3 V6 Limb Leads Chest Leads Types of Leads
Anatomy of a 12-Lead EKG (cont.) • View of Posterior Heart Wall • Leads V1 & V2 • Tall R • ST Depression • Upright T-Wave
Anatomy of a 12-Lead EKG (cont.) View of Inferior Heart Wall • Leads II, III, aVF • Looks at inferior heart wall • Looks from the left leg up
Anatomy of a 12-Lead EKG (cont.) View of Lateral Heart Wall • Leads I and aVL • Looks at lateral heart wall • Looks from the left arm toward heart *Sometimes known as High Lateral*
Anatomy of a 12-Lead EKG (cont.) View of Lateral Heart Wall • Leads V5 & V6 • Looks at lateral heart wall • Looks from the left lateral chest toward heart *Sometimes referred to as Low Lateral or Apical view*
Anatomy of a 12-Lead EKG (cont.) Lateral Wall View of Entire Lateral Heart Wall • Leads I, aVL, V5, V6 • - Looks at the lateral wall of the heart from two different perspectives
Anatomy of a 12-Lead EKG (cont.) View of Anterior Heart Wall • Leads V3, V4 • Looks at anterior heart wall • Looks from the left anterior chest
Anatomy of a 12-Lead EKG (cont.) View of Septal Heart Wall • Leads V1, V2 • Looks at septal heart wall • Looks along sternal borders
Anatomy of a 12-Lead EKG (cont.) I Lateral aVR V1 Septal V4 Anterior II Inferior aVL Lateral V2 Septal V5 Lateral III Inferior aVF Inferior V3 Anterior V6 Lateral
Anatomy of a 12-Lead EKG - ST Segment • The ST segment is normally iso-electric (baseline) neither elevated or depressed. • May slope upward toward a relatively tall T wave • The ST segment is probably the single most important element to identify on the ECG when looking for evidence of AMI.
The Three I’s • Ischemia • lack of oxygenation • ST depression or T inversion • Injury • prolonged ischemia • ST elevation • Infarct • death of tissue • may or may not show in Q wave
CARDIAC ISCHEMIA (Myocardial ischemia, Ischemic heart disease, Ischemia, Myocardium ischemia, Silent ischemia) Cardiac ischemia is a situation in which the blood flow within a coronary artery is limited to the point where the oxygen needs of the heart muscle cannot be met (hypoxia).
CARDIAC ISCHEMIA Minor episodes of cardiac ischemia tend to cause little long-term damage to the heart, but these episodes can sometimes cause serious effects in some patients: • They can cause arrhythmias, which can lead to either syncope or cardiac arrest and sudden cardiac death. • Severe or lengthy episodes can trigger a resultin myocardial infarction. • The collective effects of minor episodes of cardiac ischemia can potentially lead to cardiomyopathy.
Symptoms of Cardiac Ischemia May be painful symptoms of cardiac ischemia, • Pain, pressure or discomfort from cardiac ischemia is angina. Angina may feel like asqueezing vise or crushing pressure deep in the chest behind the sternum. May also be felt in the shoulders, arms, back, neck or jaw.
EKG in Acute Ischemia Tracing taken during an episode of anginal pain that occurred while the patient was at rest. Marked ST elevation in leads V2‑5 with some ST depression in aVF.
EKG after Acute Ischemia This tracing was taken 30 minutes after the initial. The patient was pain‑free and asymptomatic. The ST segments are isoelectric, and the ECG is normal
Evaluation after Acute Ischemia • Subsequent clinical evaluation • serial ECGs • enzyme determinations, revealed no evidence of acute myocardial infarction. Disappearance of the ST elevation and the absence of clinical and electrocardiographic evidence of infarction on subsequent examinations indicate that initial ECG is representative of severe, acute, and reversible ischemia.
Well Perfused Myocardium Epicardial Coronary Artery Lateral Wall of LV Septum Left Ventricular Cavity Positive Electrode Interior Wall of LV
Ischemia Epicardial Coronary Artery Lateral Wall of LV Septum Left Ventricular Cavity Positive Electrode Interior Wall of LV
Ischemia • Inadequate oxygen to tissue • Subendocardial • Represented by ST depression or T inversion • May or may not result in infarct
Injury • Prolonged ischemia • Transmural • Represented by ST elevation • Usually results in infarct
Injury Thrombus Ischemia
Infarct • Death of tissue • Represented by Q wave • Not all infarcts develop Q waves
Infarction Infarcted Area Electrically Silent Depolarization Many infarcts do not develop Q waves
Thrombus Infarcted Area Electrically Silent Ischemia Depolarization
Summary • A normal ECG does NOT rule out ACS • ST segment depression represents ischemia • Possible infarct • ST segment elevation is evidence of AMI • Q wave MI may follow ST elevation or depression
Pathophysiology of the AMI • Chronic accumulation of atherosclerotic plaque in coronary vessels around the heart • Fibrous plaque prone to rupture, lead to thrombytic blockage • Clots form due to damaged tissue and platelets • Both release chemicals causing a clot to form • Forms a substance called fibren that traps cells and platelets eventually blocking and narrowing • Tissue damage in AMI results from rupture of plaque on vessel walls creating a chain reaction that forms a clot in the coronary artery.