Download
1 / 31
310 likes | 328 Views
An update to CMAQ SOA module incorporating key processes like polymerization and new SOA precursors, enhancing accuracy in aerosol simulations.

E N D
Updates to Secondary Organic Aerosol (SOA) Module Bonyoung Koo, ENVIRON and Alex Guenther, NCAR with Ralph Morris and Greg Yarwood, ENVIRON RPO National Technical Meeting Adams Mark Hotel Denver, Colorado June 10, 2005
Background • VISTAS initial 2002 CMAQ V4.3 base case (Base A) exhibited large (-80%) Summer Organic Matter Carbon (OMC) underestimation bias • Revised CMAQ simulation (2002 Base C) using CMAQ V4.4 (October 2004 release) degraded OMC performance (-100% Summer OMC) compared to CMAQv4.3 (Base A) • Believe due to correction of CMAQ vertical transport mass conservation error • Resulted in intense effort at the end of 2004 to identify cause and potential corrective action for the CMAQ OMC summer underestimation bias
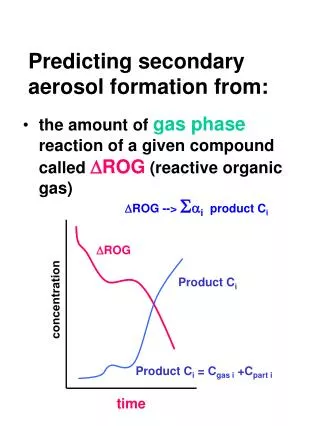
40 20 0 July April May June March August -20 October January February November December September -40 -60 -80 -100 -120 Month IMPROVE STN SEARCH SEARCH_H • VISTAS • Organic Carbon (OMC) CMAQ 36 km Fractional Bias • Base A IMPROVE/SEARCH • Base C IMPROVE/SEARCH • Mainly degradation in OMC performance toward larger underestimation
Hourly TCM Comparisons at SEARCH Yorktown, Georgia Site July 1-7, 2002 • Elemental Carbon (EC) • Primary Organic Carbon (POC) • Anthro Secondary OA (SOA_A) • Biogenic Secondary OA (SOA_B) • CMAQ SOA_A lower than CAMx • CMAQ SOA_B goes to zero • CMAQ too little TCM and too much diurnal variation driven primarily by SOA_B Found CMAQ better OMC performance for July 2002 using CMU/CAMx SOA parameters CMAQ V4.4 CAMx
CMAQ SOA Module • VOC SOA Precursors: Aromatics & Terpenes • Yields = amount of Condensable Gas (CG) obtained from VOC oxidation • Cstar = saturation concentration of condensable gas • Hvap = heat of vaporization (thermodynamics) • Oxidation: VOC + OH CG (Yields) • Equilibrium: CG SOA (Cstar and Hvap) • CMAQ transports SGTOT = CG + SOA • Split into CG and SOA in aerosol module and save for output
CMAQ V4.4 SOA Module • VOC SOA Precursors: Aromatics & Terpenes • Anthropogenic SOA from CB-IV ARO and XYL aromatic species • Biogenic SOA from BEIS3 TERPB species • TERPB Biogenic Terpenes • Based on measured lower yield/lower reactivity monoterpene species (MT1) that are believed to be overstated • Does not include higher yield/high reactivity monoterpenes (MT2) or sesquiterpenes (SQT) • CMAQ TERPB SOA parameters (yields, Cstar and Hvap) based on fit to MT1 monoterpene data from CalTech smog chambers • Two product representation
CMAQ 2-Product SOA Module fit to Chamber Data CMAQ SOA Module Parameters fit to lower yield/lower reactive (MT1) monoterpenes -pinene -pinene D3-carene Sabinene Limonene
Uncertain and Missing Processes in Current SOA Modules • Uncertain SOA Parameters: CalTech chamber data used to fit CMAQ SOA parameters have artifacts (Keywood et. al. 2003) • Polymerization: SOA becomes nonvolatile • e.g. after 20 hours 50% of SOA no longer volatile (Kalberer et al., Science 2004 303 1659; Jang et al., 2002) • Sesquiterpenes: Not included, known important SOA • Higher Yield Monoterpenes (MT2): Not included • Isoprene: Not included, high in southeastern US • New evidence that isoprene may be SOA precursor (Claeys et al., Science 2004 303 1173) that appears to be sensitive to SO2/SO4 • Biogenic OVOC: Also SOA precursor (e.g., Nonanal) • Acid Catalyzed Formation: Some biogenic SOA formation higher under more acidic conditions (e.g., isoprene)
SOAmods Updates • Constraint: Keep same CMAQ inputs so that SOAmods is plug&play with CMAQ V4.4 • Keep CMAQ 2-product SOA parameters that are fit to CalTech smog chamber for lower yield monoterpenes (MT1) • Update CMAQ SOA module to include: • Polymerization of SOA into non-volatile particles • SOA from sesquiterpenes and higher yield/higher reactive monoterpenes (MT2) • SOA from isoprene • Still missing from SOAmods module • Reactivity (decay) of Condensable Gases (CG) • SOA from biogenic OVOC emissions • Acid catalyzed reaction rates • Better linkage between gas-phase chemistry and SOA modules
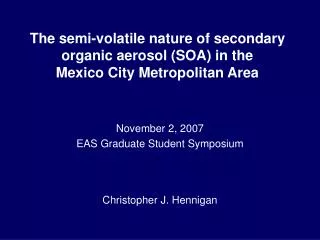
Enhanced CMAQ SOA Module G_ISP O O Y1 ISOP ISPD ISPRXN SGTOT_ISP A_ISP ASOC3 P1 (Red = New Processes in SOAmods) PAR OLE ALD2 G_TRP1 SGTOT _TRP1 Biogenic emissions * Y3 A_TRP1 EF1 * Y4 G_TRP2 AORGB O SGTOT _TRP2 TERP TERPRXN A_TRP2 EF2 * ( EEG1 * Y2 + EEA1 ) ASOC2 OVOC FPOLY All SOAs except SOC1 & SOC2 ASOC1 Polymerization PAR OLE NR O: Oxidation reaction with OH, O3, and NO3 ISPRXN: the amount of reacted ISPD with oxidants TERPRXN: the amount of reacted TERP with oxidants Dotted box: not implemented in the initial test
New SOAmods Parameters EF1 = 0.7 (mean value of 0.4 ~ 1) EF2 = 0.4 (mean value of 0.2 ~ 0.6) EEG1 = 0.325 (mean value of 0.2 ~ 0.45) EEA1 = 0.2 (mean value of 0.05 ~ 0.35) Y2 = 0.875 (mean value of 0.75 ~ 1) Y1 = 0.11 (mean value of 0.06 ~ 0.16) P1 = 0.45 (mean value of 0.15 ~ 0.75) Emission Factors (EF) and canopy Escape Efficiencies (EE) based mainly on field studies at Duke Forest, North Carolina P1 (partitioning ratio = ratio of aerosol to total (gas+aerosol)) M0 is total organic mass ~ 10 mg/m3 (used to calculate c* for CMAQ’s biogenic SOAs) Assuming (MW1/MW0) = (100/150), FPOLY = 0.025 / hr (50% polymerization for 20 hours)
CMAQ SOAmods Testing • Applied to January 2002 and July 2002 • Standard CMAQv4.4 • CMAQv4.4 with SOAmods • Continental US Inter-RPO 36 km domain • Examined Organic Matter Carbon (OMC=1.4 x OC) at IMPROVE and SEARCH and Total Carbon Mass (TCM) at STN and SEARCH_H • Examined various U.S. sub-domains • VISTAS, MRPO, MANE-VU, CENRAP, WRAP • Annual 2002 Base Case run
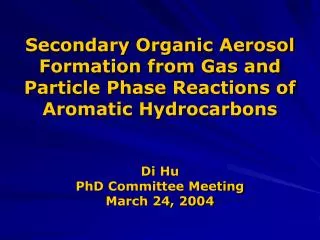
OMC at VISTAS (July 2002 ) IMPROVE & SEARCH FB: -103% -2% FB: -118% -27% CMAQ V4.4 CMAQ_SOAmods
TCM at VISTAS (July 2002 )STN & SEARCH_H FB: -93% -31% FB: -89% +2% CMAQ V4.4 CMAQ_SOAmods
OMC/TCM at MRPO (July 2002 ) IMPROVE & STN OMC FB: -76% +12% TCM FB: -57% -20%
OMC/TCM at MANE-VU (July 2002 ) IMPROVE& STN OMC FB: -82% -14% TCM FB: -82% -40%
OMC/TCM at CENRAP (July 2002 ) IMPROVE & STN OMC FB: -98% +8% TCM FB: -69% -23%
OMC/TCM at WRAP (July 2002 ) IMPROVE & STN OMC FB: +40% +84% TCM FB: -6% +21%
Summary of Results (July 2002) IMPROVE (OMC) STN (TCM)
Hourly TCM (SEARCH) at BirminghamCMAQ SOAmods July 15-21, 2002 July 12-28, 2002 • SOC1 (Polymerized), SOC2 (SQT+MT2),SOC3 (Isoprene) • Largest TCM components are SOC2 (sesquiterpenes), SOAB (MT1), and POM (primary) • Diurnal variation still greater than observed
OMC at VISTAS (January 2002 ) IMPROVE & SEARCH FB: 2% -5% FB: -42% -45%
TCM at VISTAS (January 2002 ) STN and SEARCH_H FB: -38% -48% FB: -13% -21%
TCM (SEARCH) at Birmingham January 9-15, 2002 January 2-8, 2002 • SOC1 (Polymerized), SOC2 (Sesquiterpenes), SOC3 (Isoprene) • POM largest component of TCM. SOA generally small. • Large day-to-day variations not captured by model. • Missing urban POM emissions in Birmingham???
2002 Annual Performance (OMC)CMAQ V4.4 (2002 Annual Simulation)
2002 Annual Performance (OMC)CMAQ SOAmods (2002 Annual Simulation)
SOAmods Summary • In summer, the SOAmods improves OMC and TCM performance in most RPOs, degraded in WRAP region • SOC2 (sesquiterpenes+MT2) largest contributor • Afternoon OMC/TCM peaks still too high • SOAmods parameterization based mainly on eastern US field study data, may not be representative of western US • In winter, the SOAmods does not significantly change the OMC and TCM model performance over standard CMAQv4.4 • POM largest contributor • CMAQ SOAmods OMC and TCM < CMAQv4.4 • Needs further investigation • Still OMC/TCM under-prediction bias in urban areas (e.g., STN) • Suspect missing primary OMC (POM) emissions (SMAT?)
Next Steps (VISTAS) • Further refinement of SOAmods (SOAmods2) • Add OVOC to emissions • Add SOA products from OVOC • Base sesquiterpene and MT2 emissions on TERPB and OVOC emissions • Decided not to include CG decay • Investigate primary OMC and EC emission inventories • Emissions might be too low – explain urban OMC underestimation • Compare model results to OMC measurements that have been analyzed to separate old/new and primary/secondary carbon (e.g., SEARCH analysis) • For more rural OMC events not affected by fires new Carbon will be primarily biogenic SOA
Updated SOAmods2 module (June 2005) – original CMAQ SOA module, first SOAmods update, and latest additions (SOAmods2) O O Y1 P1 ISOP ISPD ISPRXN SGTOT_ISP A_ISP ASOC3 PAR OLE ALD2 SGTOT _TRP1 Y3 A_TRP1 Biogenic emissions TERPRXN AORGB SGTOT _TRP2 Y4 A_TRP2 O EF1 TERP TERP EF2 * (EEG1 * Y2 + EEA1) SGTOT _SQT ASOC2 EF3 * (EEG1 * Y2 + EEA1) SGTOT _OVOC EF4 * (EEG2 + EEA2) P2 OVOC A_OVOC ASOC4 PAR OLE NR FPOLY All SOAs except SOC1 & SOC2 ASOC1 Polymerization
Updated SOAmods module (June 2005) Parameters EF1 = 0.7 (mean value of 0.4 ~ 1) EF2 = 0.2 (mean value of 0.1 ~ 0.3) EF3 = 0.15 (mean value of 0.05 ~ 0.25) EF4 = 0.07 (mean value of 0.02 ~ 0.12) EEG1 = 0.33 (mean value of 0.2 ~ 0.45) EEG2 = 0.38 (mean value of 0.25 ~ 0.5) EEA1 = 0.2 (mean value of 0.05 ~ 0.35) EEA2 = 0.2 (mean value of 0.1 ~ 0.3) Y1 = 0.11 (mean value of 0.06 ~ 0.16) Y2 = 0.88 (mean value of 0.75 ~ 1) P1 = 0.45 (mean value of 0.15 ~ 0.75) P2 = 0.5 (mean value of 0.2 ~ 0.8) P1 (partitioning ratio = ratio of aerosol to total (gas+aerosol)) M0 is total organic mass (assumed ~10 mg/m3) FPOLY = 0.025 / hr (50% polymerization for 20 hours)
Next Steps (MRPO) • Linked Emissions and AQ model updates in a consistent fashion to incorporate SOAmods concepts • CONCEPT biogenic emissions model update to include new (MEGAN) emission factors, additional species and other factors important to biogenic SOA formation • Mark Jansen, Jim Wilkinson and Alex Guenther • CAMx air quality model updated to interface with new CONCEPT biogenics model and SOA improvements • Kirk Baker, Bonyoung Koo, Alex Guenther, Greg Yarwood • Implementation and evaluation of new linked COCEPT/CAMx modeling system (2005-2006)
CMAQ SOAmods Conclusions • EPRI very good review of SOAmods, agreement with some processes (e.g., inclusion of sesquiterpenes) and some disagreement with processes and implementation • Recognize uncertainties in representations, but our belief is it is better to include uncertain representation of known processes than exclude completely • EPA performing laboratory tests of SOA processes and expects to formulate new module for CMAQ ~2006 • SOAmods evaluation (June-July, 2005) • SOAmods2 testing and evaluation (July-August 2005) • Implementation of SOAmods concepts in emissions model (CONCEPT) and CAMx 2005-2006 (MRPO)