Download

1 / 21
210 likes | 380 Views
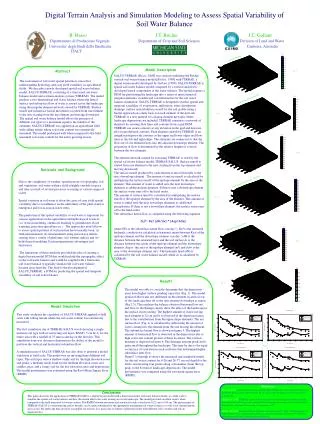
Terrain Analysis, Modeling and Classification To Aid Land Management Decisionmaking by Jacek S. Blaszczynski Physical Scientist/Terrain Modeling Specialist BLM National Operations Center Branch of Science Applications Lakewood, Colorado 80225 Jeffrey Brower Hydrologist

E N D
Terrain Analysis, Modeling and Classification To Aid Land Management Decisionmaking by Jacek S. Blaszczynski Physical Scientist/Terrain Modeling Specialist BLM National Operations Center Branch of Science Applications Lakewood, Colorado 80225 Jeffrey Brower Hydrologist BLM Price Field Office Price, Utah 84501 Tim Overdier Soil Scientist BIA Jicarilla Apache Reservation Office Dulce, New Mexico 87528
Rapid development of regional terrain and erosion databases Many current geographic databases at the field office level consist of mainly: of digitized BLM boundaries or and base data sets, such as topography (DEMs or hydrography), a few localized analytic databases (applied in resource modeling process to support land management decisionmaking for a particular watershed)
About geospatial analytic and modeling databases Analytic and modeling geospatial databases can be defined as geographic datasets that, beyond representing known ground features, also provide geospatial mapping products that reflect results of analytic techniques or models to provide additional or new information about the nature and distribution of ecosystem processes throughout the landscape. Such databases can be local or regional.
Rapidlydeveloped regional databases • Regional databases are automatically or semi-automatically derived geographic datasets providing land and resources related information for large areas -- (anywhere from several adjacent watersheds, to all the lands under the stewardship of a field office, state office or even all of the BLM lands). • Because regional databases would be derived using standardized and often fully automated methods, they would help determine both local and regional geographic distribution of various patterns and attributes of various environmental processes, but also permit comparison of these processes in distant locations.
Initial regional analytic databases • Somewhat limited by the availability of necessary datasets at this point we can offer development of two initial types of analytic databases on a regional scale: • The Erosion Potential Index (EPI) model database which utilizes quantitative data available from national databases to provide a index map of the geographic distribution of soil erosion potential based on rainfall, soil erodibility and terrain shape and would be of direct value in land management decisionmaking related to various programs. • Extensive ancillary dataset of terrain analysis products that would allow field scientists from various specialties to integrate perception of the region under their stewardship from the viewpoint of various processes affected by terrain shape and elevation.
The Erosion Potential Index (EPI) The EPI model is a derivation from the Revised Universal Soil Loss Equation empirical model and represents a fast, quantitative, regional geographic assessment of soil erosion potential on the landscape based on consistent data obtained from good sources such as National Atmospheric and Oceanographic Administration (NOAA), the National Resource Conservation Service (NRCS) and the United States Geological Survey (USGS).
The Erosion Potential Index (EPI) • The index uses the same factors as a RUSLE of application as sub-indices: These are: • The Terrain Erosion Index – based on combining the slope gradient (S) and slope length (L) factors of the RUSLE to evaluate erosion potential related to the effect of terrain morphology information derived from Digital Elevation Models (DEMs) produced by the USGS, • The Soils-Erodibility Index – based on soils erodibility (K-factor) data obtained from the SSURGO Soil Surveys, available in form of natural database from the NRCS, • The Rainfall-Erosion Index – based on rainfall factor R, calculated from precipitation atlas obtained from NOAA.
Rainfall index map for the for the northern part of New Mexico based on NOAA 2 yr-6hr data
Terrain factor map for for the northern part of New Mexicobased on USGS DEM data
A close up of the soil erodibility index map for the northern portion New Mexico based on NRCS SSURGO data (the legend shows fractional K-factor values)
The EPI map - a view of soil erosion potential if all vegetation cover was removed from the surface. A close-up of the EPI map with values being approximations of tons per acre per year. Utilizes a natural roughness which dimishes the potential amount of erosion.
The EPI map - a view of soil erosion potential if all vegetation cover was removed from the surface. A close-up of the EPI maps with values being approximations of tons per acre per year. Utilizes a natural roughness which dimishes the potential amount of erosion.
Ancillary database of terrain analytic products Some examples of terrain analysis derivatives of potential benefit to toward better understanding of the geographic distribution of the various processes occuring of the landscape ecosystems.
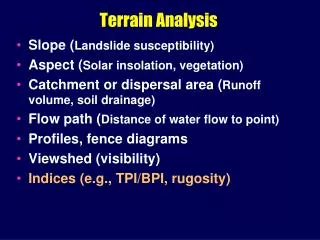
Examples of application of terrain analysis and modeling • Landscape representation and hydrological simulations • Hydrological and ecological applications • Soil erosion modeling and prediction of erosion hazard • Predicting topographic limits to a gully network • Spatially distributed solar irradiation modeling • Snow accumulation and distribution – avalanche modeling • Viewshed and least-cost path analysis • Improving resolution of climate data based on terrain • Modeling river-channel morphology • Standardized local and regional modeling of various terrain indices and parameters allowing comparison of distant locations and lots more
Hydrologic terrain analysis datasets • Hydrologic terrain analysis datasets are datasets that can be created using functions that attempt to model hydrologica processes. • These products includes topographic basins (BASIN function), nested subwatershed, streams and channels and helps classify terrain shape into crests and troughs. • Other hydrologic functions, e.g. drainage density • Will be available in the future. • Beyond HTA Software datasets other functions describe and analyze terrain shape.
Improving calculation of the area coverage of sloped terrain Various catchment models, for the example the law that connects the sediment yield ratio of upland watersheds to sediment yield ratio, can benefit from from a tool that calculates actual topographically corrected terrain in dependence on slope. This methods generally gives ratio of approximately less1.4 of topographically corrected area to map view area for test in high relief and rugged locations. One such tool is TOPAREA1.AML available on the BLM Internal Terrain Analysis site.
Area extent for each 30-m cell in square meters when corrected for shape of topography using the slope gradient method
Area extent for nested subwatersheds in square meters when corrected for shape of topography using the slope gradient method
Terrain Ruggedness Index (TRI) in meters (average height of cell above surrounding cells)
There are various other useful terrain derivatives and indices such as: Solar irradiation analysis For example, a combination of solar irradiation and an EPI map can indicate good locations for solar panels which destroy surface cover to help avoid erosion. And more: If you are interested, email to me : jblaszcz@blm.gov to me and organizers of this conference and perhaps we could have a two to four hour workshop at some point.