Download
1 / 23
230 likes | 339 Views
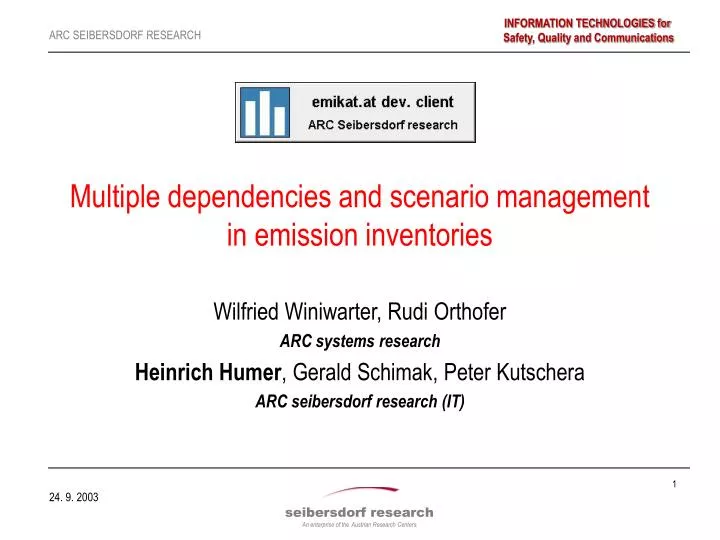
Multiple dependencies and scenario management in emission inventories. Wilfried Winiwarter, Rudi Orthofer ARC systems research Heinrich Humer , Gerald Schimak, Peter Kutschera ARC seibersdorf research (IT). Overview. Emission inventory in general Special IT problems in these tasks

E N D
Multiple dependencies and scenario management in emission inventories Wilfried Winiwarter, Rudi Orthofer ARC systems research Heinrich Humer, Gerald Schimak, Peter Kutschera ARC seibersdorf research (IT)
Overview • Emission inventory in general • Special IT problems in these tasks • Scenario Management • Multi dimensional analysis • Application service providing (ASP) concept, multi organization platform • 100 % Generation from Case-Tool as a general goal
From where? How much? What can be done? Emission inventory in general
General tasks of calculation are very simple Input Data Questionnaire Statistics Emission Factors Temporal Resolution Spatial Resolution Models emiCO = activityX * emifactCO Results Point / Line / Area Emission for SO2, Nox, NMVOC, CO, CO2 and PM10
Approaches for estimation • Bottom up • Summing up point sources and results of questionnaires, measurements and statistics to emission results for • counting units • local governmental units • districts • countries • Top down • Dividing global amounts (disaggregation) to the subunits using statistical information. • No detail information is available • Example: • Varnish by population
Special IT problems in these tasks I • Data have to be collected from several primary data sources • periodic updates with different periods necessary • Syntax- and semantic problems • Management problem • Quality assurance (quality and completeness) • Goal: • Wide range of simple import facilities of data • Support of basic data acquisition / preparation tools (Excel, flat files, …)
Special IT problems in these tasks II • All is changing over time (data and algorithms) • The set of input data depends on state of the art and the focus of the analysis. • Also models can be changed depending on state of the art and the focus of the analysis. • Data and algorithms also depend on the user. • Goal: • we need a tool for long term observation, high configurability • we need a minimum set of common conventions
Special IT problems in these tasks III • Experts in modeling inventories are not always also experts in operating data management systems • Desktop data analysis tools are not suitable for long term data management • Mixing between data and User Interface • Professional support for database and basic algorithms • Goal: • Outsourcing operation of database and basic support of application
All is changing S S S S S C C C C C E E E E E N N N N N A A A A A R R R R R I I I I I O O O O O
Scenarios and Groups • “Data groups”: • Logical associated set of input and model data (data domain) • A group can consist of table slices or of several database tables • A group has a name and description and can be modified in versions • “Scenario”: • A scenario represents for a special question and includes a set of selected versions of data groups. • Scenarios have names and description. • All modifications are logged automatically
Scenario manager • Allows comparison of data records of different situations • Different years • Different political strategies • Different models • Quality assurance for scenario evaluation • Project management tool • Version management • Not a dumb duplication of data !! • No database administrator needed !!
Architecture of database tables Version managed Parameter lists, constants Historical tables OBJECT_ID SZM_VERSION_REF CREATED_DATE .... C_xxxxx Tabellen .... ..... VAILD_FROM VALID_TO Valid version is associated in scenario manager. Versions are organisation specific. Gültige Version wird vom Referenz-Datum des Szenarios abgeleitet Calculation algorithms(Simulator) Version managed Scenario spezific results Reports, dimensions OBJECT_ID SZENARIO_REF CREATED_DATE .... Formulas
System Architecture Oracle Designer 2000 Repository Configuration is generated .xml Navigator / Browser Web access for data Administration Questionnaires Upload of data Database Oracle 9i Tomcat Web-Server multi organisation supportVersion management Web services, SOAP
Login at the application server • Java Web Start for automatic software distribution • Supporting of different clients with different characteristics (ASP concept) • Platform independent • Distributed computing
Scenario browser • Switching scenarios • Configuring scenarios • Browsing input data • Importing and exporting of data • Filtering and editing • 100% generic browser controlled by repository in the CASE tool (XML-Description of data model)
Configuring within a standard CASE tool • CASE tool as a backbone repository of generic and specific structures • End users see only configured GUIs • Definition of presentations of data (Subsets, languages) • Generating of XML-Description of user interface layout for each supported organization • Automatic distribution of XML-definitions
2. Fix position in MS Excel 1. Copying a prepared URL 3. Authentication to the server 4. Receive the results … Data access for Office Application through Web Access
Line Sources Linienquellen
Area Sources Flächenquellen