Download
1 / 21
210 likes | 241 Views
Analysis of soil nitrate levels in Montana following wheat and fallow fields in 2015, comparing grid samples to whole field composites. Soil nutrient deficiencies and pH variations also surveyed.

E N D
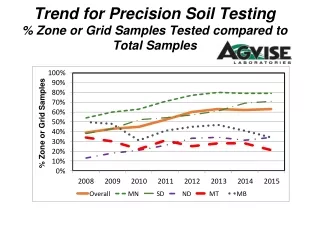
Trend for Precision Soil Testing% Zone or Grid Samples Tested compared to Total Samples
%Zone or Grid Samples Tested Compared to Conventional Whole Field Composite Samples in 2015
AGVISE Laboratories%Zone or Grid Samples – Northwood laboratory1997 - 2015 % Grid or Zone Samples Tested Compared To Conventional Whole Field Composite Samples Tested
Average Soil Nitrate following Wheat in 2015 Fall 2015 samples (lb/a 0-24” samples) 41 44 54 42 58
Soil Nitrate Variability Between Fields Following “WHEAT” in Montana - 2015
Average Soil Nitrate following Wheat in 2015 MB Fall 2015 Samples 52 (lb/a 0-24” samples) 42 49 52 24 49 46 43 38 37 36 43 43 ND 35 34 36 38 33 29 47 MN 41 48 SD 41 55
Average Soil Nitrate following “Fallow” in 2015 Fall 2015 samples (lb/a 0-24” samples) 62 59 53 52 45
Soil Nitrate Variability Between Fields Following “Fallow” in Montana - 2015
% Soil Samples with Phosphorus less than 10 ppm Fall 2015 samples (0-6”) (Olsen P test) 35% 56% 36% 56% 39% 37%
% Soil Samples with Potassium less than 150 ppm Fall 2015 samples (0-6”) 2% 4% 2% 15% 10% 4%
% Soil Samples with Zinc less than 1.0 ppm Fall 2015 samples (0-6”) 87% 80% 79% 54% 50% 50%
% Soil Samples with Sulfur less than 15 lb/a Fall 2015 samples (0-6”) 60% 53% 53% 39% 24% 52%
% Soil Samples with Copper less than 0.5 ppm Fall 2015 samples (0-6”) 1% 5% 3% 4% 1% 2%
% Soil Samples with Boron less than 0.4 ppm Fall 2015 samples (0-6”) 24% 9% 10% % 2% 8%
% Soil Samples with Chloride less than 40 lb/a Fall 2015 samples (0-6”) 76% 70% 76% 50% 52% 63%
% Soil Samples with Carbonate greater than 5.0% Fall 2015 samples (0-6”) 2% 17% 20% 9% 8% 55%
% Soil Samples with Salts greater than 1.0 mmhos/cm Fall 2015 samples (0-6”) 3% 3% 4% 4% 5% 5%
% Soil Samples with soil pH greater than 7.3 Fall 2015 samples (0-6”) 65% 76% 72% 84% 90% 63%
% Soil Samples with soil pH less than 6.0 Fall 2015 samples (0-6”) 3% 1% 1% 1% 0% 14%
% Soil Samples with %OM less than 3.0% Fall 2015 samples (0-6”) 94% 78% 71% 82% 80% 42%
Zip codes for Montana 599 595 592 594 598 596 593 590-591 597