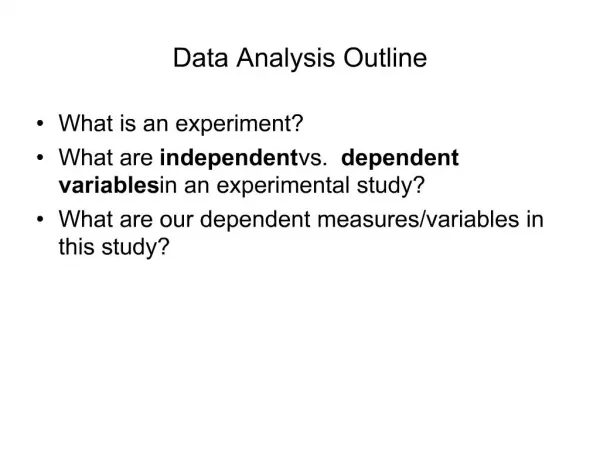
Data Analysis Outline
Goals for Today. Learn about the basics of an experimentLearn how to create a unit-weighted composite variable and how/why it is used in psychology.Learn how to create composite variables in SPSS.Learn how to compare the difference between two groups using Cohen's d.. Composite Scores. When we ha

Data Analysis Outline
E N D
Presentation Transcript
1. Data Analysis Outline What is an experiment?
What are independent vs. dependent variables in an experimental study?
What are our dependent measures/variables in this study?
2. Goals for Today Learn about the basics of an experiment
Learn how to create a unit-weighted composite variable and how/why it is used in psychology.
Learn how to create composite variables in SPSS.
Learn how to compare the difference between two groups using Cohen�s d.
3. Composite Scores When we have used multiple ways of assessing a construct (e.g., self-esteem), we often create a composite that captures the these scores.
4. It is assumed that there is variation across people with respect to the latent variable (i.e., self-esteem).
A �latent variable� is one that we assume exists, but that we cannot observe directly.
Most constructs in psychology are latent variables: memory, extraversion, self-esteem, intelligence.
6. Reverse Scored Items Some items are negatively related to the construct of interest.
Ex: �I feel I do not have much to be proud of. �
These items cannot be weighted in the same fashion as the others when creating a composite variable.
7. Unit-weighted composite To create a �unit-weighted composite��the most commonly used composite in personality psychology, do the following:
1. Reverse-key responses to items that are in the opposite direction of the construct.
8. One way to do this is to use the following formula:
(Max - X) + Min
Thus, on a 1 (Min) to 5 (Max) scale, like the one we used:
5 � X + 1
9. 2. Once the appropriate responses have been reverse keyed, simply average the responses for each person.
11. Qualifications This method is the simplest, but there are more complex ways of creating composites.
For example, sometimes responses to each variable are standardized before the averaging takes place.
In some work, the different variables are weighted differently. That is, some variables count more than others.
In other work, non-linear relationships might be assumed between the latent variable and an item response (e.g., Item Response Theory models).
12. Mean Differences The big question in our experiment is whether people�s self-esteem improves after listening to a subliminal recording containing subliminal messages designed to improve self-esteem.
13. Our Experiment Two conditions:
A. People in the �good� condition were presented with self-affirming subliminal messages, such as �You are a good person.�
B. People in the �bad� condition were presented with self-defacing subliminal messages, such as �No one likes you.�
14. Answering the Question One way of addressing the question is whether the self-esteem of people in the Condition A is higher than that of people in Condition B. (As measured after hearing the recording.)
15. Everyone has a unique self-esteem score, so we average the scores (i.e., the composite scores) for people in Condition A and separately average the scores for people in Condition B.
We want two statistics: (a) the mean, which tells us the average self-esteem value for a person in Condition X, and (b) the standard deviation (SD), which tells us the amount of variability there is around the mean in that condition.
16. Mean Difference between conditions:
(Mean of Group A � Mean of Group B)
If positive, then Group A > Group B
If negative, then Group A > Group B
If zero, then no difference between conditions.
17. If we divide the mean difference by the average SD of the two groups, we obtain a standardized mean difference or Cohen�s d.
18. Cohen�s d expresses the difference between groups relative to the average standard deviation of the scores.
19. Another Way We could also ask about the amount of change that takes place in self-esteem scores from Time 1 (before the recording) to Time 2 (after the recording).
Create a composite for the Time 1 scores.
Create a new variable in SPSS that represents the Time 2 composite � Time 2 composite scores.