Download
1 / 29
290 likes | 430 Views
Investments in Education and Socioeconomic Development. José Pablo Arellano Mexico City, August 2003. Contribution of education to development. Return on investment in education In Latin America, rates of return are among the highest Return on early investment in education is greater

E N D
Investments in Education and Socioeconomic Development José Pablo Arellano Mexico City, August 2003
Contribution of education to development • Return on investment in education • In Latin America, rates of return are among the highest • Return on early investment in education is greater • Primary education has greatest return
Return on investment in education (Source: Psacharopoulos and Patrinos, 2002)
Return on an additional year of schooling (Source: Psacharopoulos and Patrinos, 2002)
Contribution of education to growth • Review of growth theories, more emphasis on human capital (worker productivity and innovation) • Between one tenth and one third of growth due to human capital • One additional year of schooling among the work force increases per capita GDP by 6% over the long term • Contribution has been greater for developing countries in past few decades
Competitiveness and education • Surveys on international competitiveness • In 19 Latin American countries, math and science achievement averaged 3.6 vs.5.6 in Eastern Europe and 4.9 in East Asia. Public school quality averaged 2.7, 4.9, and 4.2, respectively. • Education level of work force growing slower than in other regions
Availability and Retention of Engineers High-income OECD East Asia and Pacific Eastern Europe Latin America
Equity • Growing role of education due to increased demand for qualifications • Questioning of other instruments for redistribution of income and wealth
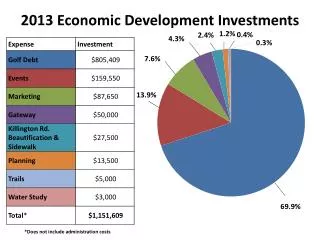
Financing: amount of resources • In 1990s, public investment in education showed highest growth in LAC, jumping from 2.9% of GDP to 3.9%. • Future resources will depend on: economic growth (salaries), lower demographic pressure, greater demand for coverage at costlier levels, family contribution (economic growth and policies)
Expanding coverage • Universal coverage of primary education increases demand for secondary and tertiary. Higher costs per student. • Achieving full secondary education coverage. Types of problems: children never enrolled, late enrolment, poor performance (low achievement, repeaters), dropouts.
Poor attending school by age 6 to 14 years old
Population attending school, by age and income 6 to 14 years old
Percentage of children in poorest two quintiles attending school at 6 and 8-9 years of age 100% 97% 95% 95% 95% 94% 90% 83% 82% 82% 80% 76% 74% 73% 73% 70% 70% 60% 50% 50% 40% 35% 34% 30% 20% 10% 0% Colombia 2000 Bolivia 1997 Brasil 1996 Rep Dominicana Guatemala 1999 Haití 1994-95 Nicaragua 1998 Perú 2000 1996 Minimum attendance Maximum attendance
Latin America (18 countries): Dropout rates for adolescents aged 15-19, by area Overall dropout rate Urban areasRural areas Simple average Simple average
Clear progress in reducing dropout rates in the 1990s. For 18 countries in LAC, rate dropped from 45% to 37% (from 32% to 27% in urban areas, and from 64% to 51% in rural areas) • More emphasis needed on starting school on time • Policies on incentives and benefits according to age of children • Reducing age children enter school vs. increasing coverage at an older age • Dropout rates associated with teenage pregnancy: very high and have increased in most of the countries in past 15 years • Policies to finance expansion of higher education
Breakdown of spending(S) • S = HS x H x T • S/GDP = (HSxH/pcGDP)x(T/ST)x(ST/N)x(N/P) • HS: Hourly teacher salary • H: Hours of teaching per teacher contract • T: Teachers • ST: Students • N: School-age population • P: Total population • GS: Grade-age students • RS: Late-starter and/or repeater students
Quality: student achievement • International test results • Is it a resource problem? • How to improve the use of resources?
Level 1 Below Level 1 Levels 2 & 3 Level 4 Level 5 PISA 2000 performance by 15-year-old students (reading comprehension test) 3 5 100% 5.7 9.5 6 9 18.5 18.7 90% 19 80% 22 31 41 47 70% 49 26 46 26 32 60% 50% 50 40% 33 57 42 28 21 28 30% 43 54 20% 23 12 23 20 10% 9 16 5 5 6 5 0% New Zealand OECD average Argentina Brazil Chile Mexico Peru Finland Korea
100% 2.1 3.5 3.4 5.4 8.5 6.5 11.8 17.6 90% 27.6 28.0 19.8 80% 15.6 29.2 33.6 34.8 70% 30.0 60% 16.0 22.1 33.0 20.4 50% 16.2 44.9 9.2 40% 15.8 54.0 14.3 17.2 40.9 30% 43 10.6 20% 39 32 28 5.3 24 10% 4.5 4.9 11 6 5 0% O E C D average Argentina Brazil Chile Mexico Peru Finland Korea Not in System Level 1 Levels 2 & 3 Level 4 Level 5 Below Level 1 PISA 2000 performance by 15-year-old population (reading comprehension test)
Differences in math test performance (OECD vs. LAC 90th percentile) 700 655 650 600 550 536 502 500 496 464 450 431 400 350 326 300 5 10 25 50 75 90 95 Percentile OECD Argentina Brazil Chile Mexico Peru
Differences in math test performance (Korea vs. LAC 90th percentile) 700 676 650 600 550 536 502 500 496 464 450 431 400 350 5 10 25 50 75 90 95 Percentile Korea Argentina Brazil Chile Mexico Perú
Spending per student (primary) vs. reading test performance (PISA 2000) 600 Fin 550 Aus Kor U.K. Swe. Jap Nor Fra U.S.A. Czech Rep. 500 Spa. Austria Ger. Swi. Den. Ita Gre Hun Pol Por Performance 450 Mex Chi Arg 400 Bra 350 Peru 300 5% 10% 15% 20% 25% 30% Spending per student / per capita GDP
System governance • Decision-making and decision-makers: Who is responsible and what are the consequences? • Examples of problems: teacher absenteeism, lack of evaluation; politization and/or strong influence of teacher unions on appointments and promotions • Overregulated system that maintains decision-making and administration system designed prior to mass education • High turnover among senior education ministry officials and discontinuity of policies • Parents and other stakeholders have little say