Download
1 / 11
120 likes | 261 Views
A geological perspective of sea-level change. Eelco J. Rohling Research School of Earth Sciences. IBS Seminar August 2013. Latest continuous sea-level records over last half million years (Red Sea). Good agreement with fossil corals (green).

E N D
A geological perspective of sea-level change Eelco J. Rohling Research School of Earth Sciences IBS Seminar August 2013
Latest continuous sea-level records over last half million years (Red Sea) Good agreement with fossil corals (green) Clear match with Antarctic Temperature anomaly record (orange) Rohling et al., Nature Geoscience 2, 2009 Data available from: http://www.highstand.org/erohling/ejrhome.htm • Average time resolution 200-250 y
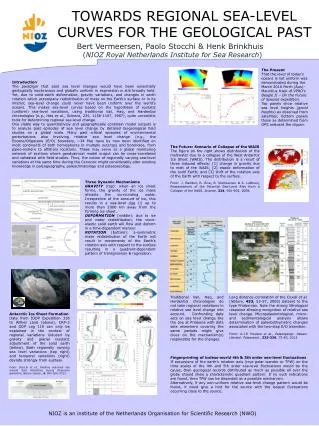
Estimating the modern long-term disequilibrium: Evidence for equilibrium sea-level relative to CO2 from data of the past 40 million years (Foster et al., 2013 PNAS)
MIS 5e MIS 6 Stanford et al., Paleoceanography 2006 Individual site records for three deglaciations Last deglaciation (Barbados) Mean rate of rise around 1 m century-1 Meltwater pulses 1a and 1b: up to 4.5 m century-1 Tahiti data show mwp 1a at 4.6+/- 0.6 m century-1 (Deschamps et al., 2012 Nature) Penultimate deglaciation Similar rates of rise Blue, black, red: Termination II Grey: Termination I Onset MIS 11 similar rates as last deglaciation Siddall et al., Geology 2006 Rohling et al., EPSL 2010
Statistical assessment for the last deglaciation (Stanford et al., 2011 GPC) Uses all quality far-field data, with all uncertainties in both age and sea-level directions. It suggests robust values of up to 2.5 m per century (95% confidence). But note, this procedure includes an amount of smoothing, so values found are minima
Rates of rise 2 – rises within the last glacial cycle: Millennial events of last glacial cycle show rates of rise of order 1-2 m century-1 Siddall et al., Nature 2003 Rohling et al., Nature 2004 Also note response time lags of only several centuries Grant et al., Nature 2012
Structure of two main & one minor peak, separated by lowstands, corroborated by stratigraphic reef sequences (Bruggemann et al., 2004) 3 2 1 Rates of Rise 3 – times when sea-level rose ABOVE the present: Rohling et al. Nature Geoscience, 2008 • Last interglacial: world avg. only up to (likely less than) 2 °C warmer than today. Greenland 3-5 °C warmer • Mean sea-level highstand 4-6 m above present (peaks considerably higher, up to ~9 m) • Less than half of the high-stand due to Greenland melt (but not all Antarctica involved !) • Rate of rise above 0m: 1.6 ± 1.0 m century-1 • i.e., 2-3 times max IPCC rate A modelled “best estimate” Eemian Greenland ice sheet (Cuffey and Marshall, 2000) RATES 2 1 3
Probabilistic global summary for last interglacial concludes 1000-y mean value for Last Interglacial sea-level ‘jumps’ of order0.6 to 0.9 m century-1 (SL reached up to 8±1 m above the present!) (Kopp et al., 2009 Nature). New chronology for Red Sea sea-level record (Grant et al., 2012 Nature) established that 1000-y mean value for the rise between -5 and +5 m of 0.7 ± 0.4 m century-1. Global perspective strongly suggests that the ice loss responsible took place on Southern Hemisphere Rohling et al., Nature Geoscience1, 2008 Kopp et al., Nature 462, 2009
Summary of past observations: • Rates of sea-level rise during times of climatic warming typically reached mean values of ~1 m century-1. • Similar mean rates seen during 30 m rises within the last glacial cycle (Siddall et al., Nature 2003; Rohling et al., Nature, 2004) • Maximum rates observed during deglaciations: • Statistically robust (95% confidence) values up to 2.5 m century-1 • Single-site interpolations suggest absolute max. of 4.5 m century-1 • Final bit of the last deglaciation still at rates of 1 ±0.3 m century-1 (Carlson et al., Nature Geoscience 2008 – not shown here) • Rises to 8±1 m above present-day sea-level at rates of order 1 m century-1 (Rohling et al., Nature Geoscience 2008; Kopp et al., Nature 2009; Grant et al., 2012 Nature) • Likelihood of such values of sea-level rise w.r.t. modern ice dynamics: • Current global understanding of ice dynamics allows modern rates of 0.8 to 2.0 m century-1 (Pfeffer et al, Science 2008) • Antarctica alone may account for modern rates of up to 1.5 m century-1 (SCAR report, 2009) Also: Grant et al. (2012 Nature) observed that system response time lags are only several centuries
Current sea-level rise is strong by a natural interglacial standard (nat. interglac. values lie in lower half of 68% interval). But: coincidence with Pfeffer et al. (2008 Science) ‘best-estimate’ for 2100 suggests trajectory does not require unprecedented physics. 2m by 2100 would require pathway to eventual rates of order 4.3 m/cy-1 unlikely for existing volume of ice, except if unprecedented processes occur (e.g., collapse of WAIS). Equally ‘special’ conditions needed for semi-empirical projections for higher emissions scenarios. 2m by 2100 seems reasonable upper limit for planning. Rohling et al., subm. Scientific Reports
Conclusions • Past rates of rise offer natural context to future sea-level rise • Our natural rates are total response rates (including thermosteric effects, etc.) for the global scale • Natural rates of rise typically 1 to 2 m century-1 during variety of climate background states • Reviews of modern ice dynamics support such rates as possible today • My scenarios based on these natural rates suggest 0.2 - 0.9 m of rise by 2100 and 0.7 – 2.6 m by 2200 (68% probability) • For 390-400 ppmv CO2, natural equilibrium would be of order 24 -15/+7 m (68%) • Last Interglacial shows that fast rise continuing at least up to +8 or +9 m could happen without any dramatic change in circumstances • Geological perspective suggests that: • current rise is on a high trajectory, but within the range of understood ice-dynamical processes; i.e., nothing truly exceptional (yet) • ~2 m by 2100 is a reasonable worst-case maximum for planning, and to be anticipated only if strong emissions continue • around 2200, more than 2m rise is a reasonable expectation even if no further emissions took place from today (worst-case maximum around +5 to +6 m).