Download
1 / 40
400 likes | 783 Views
Use of Inpatient Survey Results. Results of an online survey of acute hospital trust survey leads for 2005 inpatient survey. Background. Objectives To establish how trusts currently use the survey results To identify ways in which we might be able to help them:

E N D
Use of Inpatient Survey Results Results of an online survey of acute hospital trust survey leads for 2005 inpatient survey
Background • Objectives • To establish how trusts currently use the survey results • To identify ways in which we might be able to help them: • to use the results more effectively • and to disseminate them more widely • Methodology • The survey was conducted online • All 2005 survey leads (n.169) were e-mailed in early November 2006 to invite them to take part (with follow up mailing to replacement contacts, where notified) • Two targeted reminders were sent to non-responders at weekly intervals to encourage participation (with a final, third, reminder included in a routine e-bulletin from the Acute Co-ordination Centre)
Response Rates • 76 trust survey leads completed the questionnaire, giving a “raw” response rate of 45% • After adjustment for known “undelivered” e-mails (i.e. “bounce-backs” due to invalid e-mail addresses/rejection by SPAM filters) response rate was 47% • Response rate amongst “in-house” trusts was marginally higher than for those using a contractor, hence all quantitative results have been adjusted at the analysis stage to give appropriate weight to the views of each group • The job functions of those responding, and giving a job title, were: • PALS/PPI 40% • clinical governance managers 22% • senior managers, including clinical directors 16% • audit and information staff 11% • others 11%. • A chart showing dates of returned questionnaires is appended (Appendix 1)
Key findings: Current use/dissemination of results • All survey outputs are widely used. However, the initial results (from a contractor or in-house team) are used the most. This is probably because they are: • available earlier • easier to analyse/manipulate • Most trusts (82%) do additional analysis of the data – particularly looking at trends and comparing across sites/specialties or with other trusts • nine out of 10 also use, and value, the open-ended patient comments • Benchmark reports are generally found more useful than the national tables – mainly because the latter are felt to be difficult to find and manipulate • All results are widely disseminated throughout the trust, with presentations made to a number of groups and findings also shared through intranet, newsletters and various other fora
Key findings: Help in analysing/using the data Trusts would particularly welcome: • Case studies (how others have used the data) • And [statistical?] help in: • comparing with other trusts • understanding trends • understanding the weighting used (e.g. in benchmark reports/national tables)
Key findings: Help in publicising/disseminating the data The most popular suggestions were: • Generic fact-sheets for patients and staff explaining the purpose/use of patient surveys • Templates for fact-sheets and presentations for trusts to slot in their own results • It was also felt by some (around 4 in 10) that the presentation of the results on the Healthcare Commission website could be improved, e.g.: • More historical comparisons • More explanation of results • Better use of graphics • In general, make the results easier to find
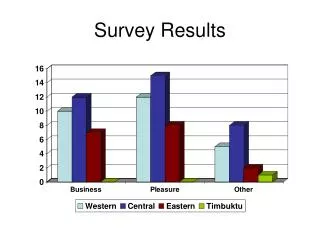
Survey Outputs Used (%) Which, if any, or the survey outputs listed below does your trust use? Which one of these outputs do you use the most?
Types of additional analysis done(% mentioning each type of analysis) Based on 82% of trusts who do additional analysis
Use of patient comments 89% of trusts say they use the patient (open-end) comments. The number of trusts mentioning each “theme” is as follows: Asked of those who analyse/use the open-ended comments
Use of patient comments: some examples • “These are the 'diamonds' in the patients survey because they make the statistics real and meaningful…. The comments help stop any tendency to challenge the data on the stats.” • “Break down into specialty and then into different themes – food, cleanliness, staff attitude & service provision positive/negative, medication issues, clinical issues, information & communication.” • “ We produce posters with comments on for use at action planning workshops.” • “We use the comments for a wide range of training opportunities such as Trust induction, Jnr Docs induction, Student Nurse Training etc.” • We circulate the comments widely and use examples in poster displays to raise awareness of the survey.”
Is there a dedicated person within the trust responsible for analysis and reporting of results? “Other(s)” are mainly: PALS/PPI Senior management inc. clinical directors Audit & information staff
Ease of understanding & usefulness: Benchmark Reports & National Tables Benchmark Reports National tables Understanding Usefulness Understanding Usefulness
How are the Benchmark Reports used? 97% of trusts say they find the Benchmark Reports very or quite useful. The number of trusts mentioning each “use” is as follows: Asked of the 74 trusts saying they found the benchmark reports very or quite useful
How could the Benchmark Reports be improved? The number of trusts suggesting each type of improvement is as follows: Asked of the 74 trusts saying they found the benchmark reports very or quite useful
How are the National Tables used? 67% of trusts say they find the National Tables very or quite useful. The number of trusts mentioning each “use” is as follows: Asked of the 51 trusts saying they found the national tables very or quite useful
How could the National Tables be improved? The number of trusts making detailed criticisms, or suggesting improvements, is as follows: Criticisms asked of the 15 trusts saying not very useful. Suggestions asked of 66 trusts - 15 saying national tables not very useful + 51 saying they found them very or quite useful
Who sees initial trust results from contractor/in-house team?
Summary of presentations made to different audiences (by contractor and/or in-house team) The following two slides show the break down between presentations made by contractors and those made by in-house teams
Presentations made by external contractor to different audiences Based on those receiving data/report from external contractor (unweighted base 57 trusts)
Presentations made by internal staff/ trust survey lead to different audiences
Other ways in which shared with different groups (number of trusts mentioning each) Based on those saying results disseminated to “other” groups
Other ways in which trusts share the results • “..used for focus group work..” • “We have an annual Patient and Public awareness day and the results are always displayed then. There is always someone on hand to discuss any aspects of the survey that people wish to raise.” • “ …large workshop events with key stakeholders from PCT, SHA, local patient forums and user groups including patient groups to discuss the results and prioritise areas for action.” • “…Patients’ Panel newsletter that is circulated throughout local community groups, wards and departments in the hospital, all local GPs and members on the Panel.” • “In-house magazine.” • “Monthly communications bulletin to all staff.”
Levels of action planning within the trust using the survey results In most trusts (91%) action plans are followed through with a dedicated person, or persons, leading, monitoring and checking progress. Based on the 99% of trusts who use the results in action planning
Ways in which improvements publicised to patients/the general public Based on the 69% of trusts who publicise improvements identified through the results to patients/the general public
Do you specifically mention that improvements have been identified through the survey results? Based on the 69% of trusts who publicise improvements identified through the results to patients/the general public
Preferred options for help in analysing/interpreting/reporting on findings (% mentioning each option)
Preferred options for help in disseminating results (% mentioning each option)
Usefulness of the survey section of the Healthcare Commission website
Do you think the Healthcare Commission’s presentation of survey results on the site could be improved? Based on those aware of this section of the site
Agreements with suggested improvements to presentation of survey results on Healthcare Commission website Based on the 39% of respondents who felt the Commission’s website could be improved
Appendices • Return of completed questionnaires • Who analyses and reports on the results
Return of completed questionnaires First mailing Replacement contacts First reminder ACC e-bulletin November 2006
Who analyses and reports on the results? *inc. clinical directors