Download
1 / 18
200 likes | 387 Views
Mean vs. Median, Box Plots, and Measuring Spread by standard deviation. AP Statistics. Mean: A measure of the center. Add the values of your observations and divide by the number of observations. FORMULA: If the n observations are their mean is.

E N D
Mean vs. Median, Box Plots, and Measuring Spread by standard deviation AP Statistics
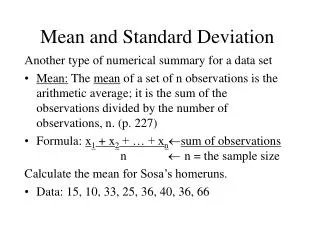
Mean: A measure of the center • Add the values of your observations and divide by the number of observations. • FORMULA: If the n observations are their mean is
Median: The median M is the midpoint of a distribution. The number such that half the observations are smaller and the other half are larger. To find the median of a distribution • 1. Arrange all observations in order of size, from smallest to largest. • 2. If the number of observations n is odd, the median M is the center observation in the ordered list. • 3. If the number of observations n is even, the median M is the mean of the two center observations in the ordered list.
Mean vs Median • Use “one variable statistics” to check results on your calculator
Given: Hank Aaron’s home run scores in his first 21 seasons 13 27 26 44 30 39 40 34 45 44 24 32 44 39 29 44 38 47 34 40 20 • Find the Mean of the data. • Mean: 34.9 • Find the Median of the data. • Median: 38
Measuring Spread: The Quartiles • Arrange the observations in increasing order and locate the median M in the ordered list of observations • The first Quartile is the median of the observations whose position in the ordered list is to the left of the location of the overall median • The third Quartile is the median of the observations whose position in the ordered list is to the right of the overall median
Find the Quartiles of Hank Aaron’s counts. • You can do it by hand: • OR YOU CAN USE ONE VARIABLE STATS
The interquartile range (IQR) • the distance between the first and third quartiles • Formula • IMPORTANT PROCESS FOR FINDING OUTLIERS!!!!!!!!!!!!!!: Call an observation an outlier if it falls more than 1.5 x IQR above the third quartile or below the first quartile
The five number summary • consists of the smallest observation, the first quartile, the median, the third quartile, and the largest observation, written in order from smallest to largest • In symbols, the five number summary is Minimum M Maximum
Barry Bonds Home Run Counts Hank Aaron’s Home Run Counts
Modified Boxplots: Graphs of the five number summary with outliers plotted individually • A central box spans the quartiles • A line in the box marks the median • Observations more than 1.5 x IQR outside the central box are plotted individually • Lines extend from the box out to the smallest and largest observations that are not outliers
Variance • The variance of a set of observations is the average of the squares of the deviations of the observations from their mean. • FORMULA FOR VARIANCE:
Standard Deviation • The Standard deviation s is the square root of the variance • FORMULA for standard deviation is
Degrees of Freedom • Degrees of freedom are found by subtracting 1 from the number of observations n (n -1)
Example: A person’s metabolic rate is the rate at which the body consumes energy. Here are the metabolic rates of 7 men who took part in a study of dieting. • 1792 1666 1362 1614 1460 1867 1439 • Calculate • 1600 • Calculate • 35, 811.67 • Calculate s • 189.24
Properties of Standard Deviation • S measures the spread about the mean and should be used only when the mean is chosen as the measure of the center • S=0 only when there is no spread. This happens when all of the observations have the same value. Otherwise, s > 0. As the observations become more spread out about their mean, s gets larger • S, like is not resistant. Strong skewness or a few outliers can make s very large.
IMPORTANT: CHOOSING A SUMMARY • The five-number summary is usually better than the mean and standard deviation for describing a scewed distribution or a distribution with strong outliers. • Use ans S only for reasonably symmetric distributions that are free from outliers • ALWAYS PLOT YOUR DATA