Download
1 / 12
150 likes | 857 Views
Learn about essential statistical measures, including mean, median, mode, and standard deviation, used to summarize and compare datasets. Explore central tendency and dispersion with practical examples and calculations for better understanding.

E N D
Statistics: Numerical values used to summarize and compare sets of data Measure of central tendency: A number used to represent the center or middle of a set of data values.
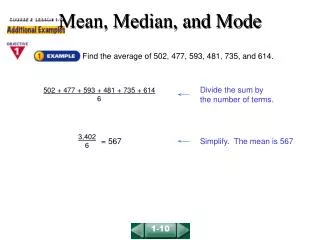
Example1 Below are the intervals (in minutes) between eruptions of the Old Faithful geyser in Yellowstone National Park. Calculate the mean, median, and mode for the dataset: 98 92 95 87 96 90 65 92 95 93 98 94
Measure of dispersion: A statistic that tells you how dispersed, or spread out, data values are Range: The difference between the greatest and least data values.
Standard deviation: A measure that describes the typical difference (or deviation) between a data value and the mean Variance: The average (mean) of the squared differences from the Mean