Download
1 / 19
190 likes | 228 Views
This example problem showcases the application of stepwise regression in parameter estimation for a complex dynamic system representing ethanol fermentation. The process involves selecting significant parameters using a global search and minimizing relative errors in the model.

E N D
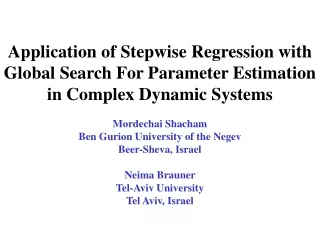
Application of Stepwise Regression with Global Search For Parameter Estimation in Complex Dynamic Systems Mordechai Shacham Ben Gurion University of the Negev Beer-Sheva, Israel Neima Brauner Tel-Aviv University Tel Aviv, Israel
Description of the example problem: Kinetic Model of ethanol fermentation1 x - concentration of cell mass s - concentration of glucose p1 - concentration of ethanol p2 - concentration of glycerol 0.1≤ Yp1/s ≤ 0.51 - ethanol yield factor 0.1≤ Yp2/s≤ 0.2 - glycerol yield factor. 19 parameters 1 Liu and Wang, Comput. Chem. Eng. 33, 1851-1860, 2009.
Part of the Data Available for Parameter Identification1,2 x - cell mass concentration s - glucose concentration p1 - ethanol concentration p2 - glycerol concentration 1Wang, et al., I&EC Research, 40, 2876-2885, 2001. 2 Gennemark and Wedelin, Bioinformatics, 25, 780-786, 2009.
Search for Optimal Parameter Values for a Particular Parameter Set Subject to: MATLAB Global search functions scatter search, fmincon (constrained) and nlinfit used for solution Minimization of the relative error (measurement errors are relative errors)
Derivation of the “pruned” Model for the Example Problem1 Six parameters with extremely large values are removed, yielding lower objective function value 1 Liu and Wang, Comput. Chem. Eng. 33, 1851-1860, 2009.
The Rational • Estimation of parameters of dynamic models using experimental data of the state variables is an essential part of the modeling and analysis of chemical and biological systems. • There is often uncertainty regarding the terms and parameters that should be included in the dynamic model. The available data is usually subject to experimental error. • A stepwise regression algorithm1 is proposed to select the most significant parameters and obtain reliable estimates for their values. • The parameters often have physical meanings and their calculated value must be consistent with these meanings. • A brief description of the “stepwise regression” process follows. 1Comput. Chem. Eng. 69, 26-38, 2014.
Initial Model Analysis and Modification to Enable Stepwise Regression for Nonlinear Problems Definition of new parameters to enable addition of one parameter at a time to the model and setting the rest of the parameters at zero. Classification of the parameters’ hierarchy within the model’s various expressions. Keeping parameters constrained to nonzero values in explicit forms. Selection of an initial feasible set of parameter values from amongst the 1st hierarchy and nonzero constrained parameters, which is sufficient for representing the initial trend of the state variables and ensures that none of the state variables remains constant during the integration.
Groups of terms and Re-parameterization Groups are the largest collections non-additive terms. Re-parameterization of a group starts by division of the expressions by the free parameters appearing in the denominators. For example: Group 1 Is first divided by Ks, Kp1I and K2I Re-parameterization is carried out for preventing division by zero. Group 1
Re-parameterized Model and Parameter Hierarchy 0.1≤ Yp1/s ≤ 0.51 0.1≤ Yp2/s≤ 0.2 The initial minimal parameter set includes Yp1/s, Yp2/s, π1 , π2 , π3.
Parameter Estimation for the Pruned Version of the Example Problem To demonstrate the inherent limitations of the parameter identification process the (pruned) model of Wang et al1. with their proposed parameter values is used to generate artificial data (with/without) experimental error. Stepwise regression is carried out to identify the parameters that need to be included in the model to obtain the best representation of the data. Stopping criterion - addition of none of the remaining non-basic parameters could reduce the objective function value. Comparison of the calculated parameter values with those used to generate the data to determine whether the model structure and the data precision allow identification of the correct parameter values.
Part of the Data Used for Parameter Identification x - cell mass concentration s - glucose concentration p1 - ethanol concentration p2 - glycerol concentration The data was generated using the 13 parameters (pruned) model of Ref. 1, to enable comparison of the minimal set of parameters model with the pruned set. 1Wang, et al., I&EC Research, 40, 2876-2885, 2001.
Initial Basic Parameter Set and Search for Additional Parameters to Enter the Set Initial basis Selected optimal parm. π10
Parameter Values obtained, for the Pruned Model, with no Error in the Generated Data 11 out of the 13 parameters can be identified : Prediction error proportional to size.
Plot of the Data and Calculated Values Using the Optimal 8 Parameters Model (no experimental error in data) s - concentration of glucose p1 - concentration of ethanol Very good agreement between the calculated and the exact state variable values.
Plot of the Data and Calculated Values Using the Optimal 8 Parameters Model (no experimental error in data) x - concentration of cell mass p2 - concentration of glycerol Very good agreement between the calculated and the exact state variable values.
Parameter Values obtained, for the Pruned Model, with various Error Levels in the Generated Data For most parameters the deviation increases monotonously with the increase of the error level
Plot of the Data and Calculated Values Using the Optimal 8 Parameters Model (5 % experimental error in data) s - concentration of glucose p1 - concentration of ethanol The error appears to be prominent for the larger variable values, because of the use of relative error
Plot of the Data and Calculated Values Using the Optimal 8 Parameters Model (5 % experimental error in data) x - concentration of cell mass p2 - concentration of glycerol The error appears to be prominent for the larger variable values, because of the use of relative error
Conclusions • The role of the stepwise regression method in parameter estimation of dynamic systems has been investigated using a data set generated using “exact” parameter values. • The method can successfully determine a set of parameters needed for representing the data. The representation precision largely depends on the “experimental error”. • It has been demonstrated that even with relatively small “experimental error” some parameters may be unidentifiable. The two main reasons: • High correlation between parameter values associated with the same state variables. 2. Very small parameter values which result in insignificant effect of the associated terms on the objective function.