Download

1 / 21
210 likes | 361 Views
Performance results with the Total Energy - Mass Flux PBL scheme. Wayne M. Angevine CIRES, University of Colorado, and NOAA ESRL. What is TEMF and what is it good for?. Level 2.5 scheme Total turbulent energy as prognostic variable Mass flux for non-local transport in convective BL

E N D
Performance results with the Total Energy - Mass Flux PBL scheme Wayne M. Angevine CIRES, University of Colorado, and NOAA ESRL
What is TEMF and what is it good for? Level 2.5 scheme Total turbulent energy as prognostic variable Mass flux for non-local transport in convective BL Integrated shallow cloud Available in WRF since v3.3 Intended to improve simulations with shallow cloud and/or stable boundary layers Cloud top hd LCL
CalNex cases Two-month runs WRF REF configuration: 36/12/4 km horizontal grid, inner grid covers all of California ERA-Interim initialization 60 vertical levels, 18 below 1 km, lowest level ~15 m Eta microphysics RRTM-G radiation (LW & SW) Grell-Devenyi cumulus, outer domain only MYJ boundary layer & surface layer Navy GODAE high-resolution SST (6-hourly) WRF TEMF configuration: Same as REF except for TEMF boundary layer and surface layer on domains 2 and 3 COAMPS: Navy operational mesoscale model run at Pt. Mugu by Lee Eddington NOGAPS initialization, warm start mode, no data assimilation
Profiles over water near Catalina Island Obs have ~550 m roughly well-mixed cloudy BL with strong, sharp inversion and dry layer above MYJ has shallow, stable BL No cloud water because profile is unsaturated TEMF BL matches obs well Not saturated at grid scale COAMPS has shallow BL with good temp and moisture Red = P3 obs Blue = WRF MYJ Green = TEMF Cyan = COAMPS
San Nicolas Island soundings 44 soundings during May-June 2010 TEMF has less error in upper BL (~300-500 m) because its BL is deeper Note difference between MYJ and TEMF initialized with ERA-Interim is less than between MYJ with ERA and with GFS (dashed) Red = obs Blue = WRF MYJ Green = TEMF Cyan = COAMPS
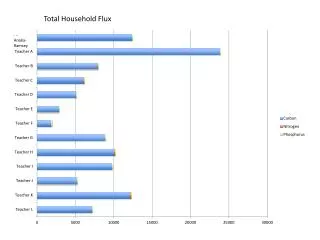
Chowchilla PBL heights Noah Slab TEMF San Joaquin Valley site 2100 UTC = 1300 LST TEMF with Noah LSM is least biased and best correlated, BUT difference between LSMs is greater than difference between PBL schemes MYJ
Chowchilla low-level jets San Joaquin Valley site 1200 UTC = 0400 LST Averaged over 32 nights with “reasonable” LLJs, no normalization No significant difference between PBL schemes Both slightly overestimate strength and sharpness of jet compared to observations (which are also uncertain)
MYJ TEMF Effective bulk transfer coefficient for heat (CH) PXLSM (Normalized) heat transfer decreases at strong stability in TEMF, not in MYJ Unstable behavior depends on LSM Stable Unstable Noah LSM Thanks to Michael Tjernström for the idea
MYJ TEMF Drag relationship Night (0400 LST) TEMF has less stress at small speed TEMF has fewer very small speeds at night Little LSM dependence at any time (not shown) Day (1300 LST)
BLLAST case • Boundary Layer Late Afternoon and Sunset Turbulence study • Lannemezan, France, June-July 2011 • Planned mesoscale intercomparison • Presenting preliminary WRF results for 30 June • At primary measurement site • 4D, advection very important • Two PBL schemes (MYJ and TEMF) • Two land surface models (Noah and Pleim-Xu)
BLLAST profiles 30 June vs. soundings Temperature and moisture bias depends on PBL scheme and LSM All too cool & low except TEMF w/PXLSM (which is too hot & high) 3D case so non-local effects vary/dominate – not just the local column! Red = obs Blue = MYJ Green = TEMF Solid = Noah LSM Dashed = PX LSM
BLLAST profiles 30 June vs. soundings Wind speed profiles not simple in afternoon LLJ in evening, too high in all simulations TEMF/Noah has no LLJ TEMF/PXLSM LLJ is too strong Red = obs Blue = MYJ Green = TEMF Solid = Noah LSM Dashed = PX LSM
BLLAST Entrainment Sfc flux Entrainment flux ratio is about 0.2 midday but larger early and late Reinforces hypothesis that entrainment depends on various processes, which are more important when surface flux is less Only TEMF shown Minimum flux Entrainment flux ratio
BLLAST cloud 30 June at main site Reality was mostly cloudy all day No simulation has midday cloud
TEMF Status Released in WRF v3.3 Documented: Angevine et al. (2012) MWR, Angevine et al. (2010) JAMC, release notes Known deficiencies: Sometimes crashes when thunderstorms are present No ice phase Interface to radiation not in released version Several limits and tweaks for numerical stability Handling of water surface in WRF is crude Further evaluation, comparison, and development needed
Conclusions(?) and prospects TEMF shows more “ideal” behavior in heat transfer and drag relationships More “sensitive”, fewer empirical limits – good or bad? TEMF performs better for stratocumulus off California Low-level jets are OK with either TEMF or MYJ PBL For BLLAST, PBL scheme and land surface model make about equal differences Cloud in BLLAST case is poor in all simulations The whole system matters: Initialization, land surface, etc. PBL scheme is constrained above, below, and on all sides Differences are not bigger because (numerical) stability and other constraints don’t allow it
Thanks to: Thorsten Mauritsen (TEMF development) Lee Eddington (COAMPS) NOAA ESRL High-Performance Computing Program Stephan de Roode (help with cloud fraction parameterization) James Cummings, Naval Research Lab (SST data) Michael Trainer, Sara Lance, NOAA ESRL, and NOAA AOC (WP3 data) NOAA ESRL PSD (CCL wind profiler data) Marie Lothon, Fabienne Louhou, David Pino, Fleur Couvreux (BLLAST experiment and intercomparison setup)
MYJ TEMF Effective bulk transfer coefficient for heat (CH) PXLSM (Normalized) heat transfer decreases at strong stability in TEMF, not in MYJ Zoomed in on stable branch Stable Unstable Noah LSM Thanks to Michael Tjernström for the idea
BLLAST sensible heat flux Absolute Afternoon timing related to maximum magnitude (larger peak happens later) NOAH LSM rises and falls earlier (less ground heat storage or greater resistance?) TEMF makes less heat flux than MYJ (contrary to expectations, due to 3D effects?) Blue = MYJ Green = TEMF Solid = Noah Dashed = PXLSM Normalized
TE from TEMF BLLAST Energy variables Diurnal cycle on 30 June Scaled to maximum in each plot, same zero Min. TKE in MYJ is 0.1 TEMF TE shows some response to intermittent nocturnal events (some support in data) (with Noah LSM) TKE from MYJ
BLLAST cloud impact 14Z 30 June Some cloud present over site, what height?