log[CCaMK conc (µM)]
10 likes | 120 Views
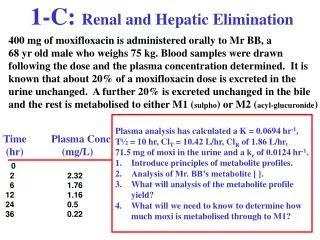
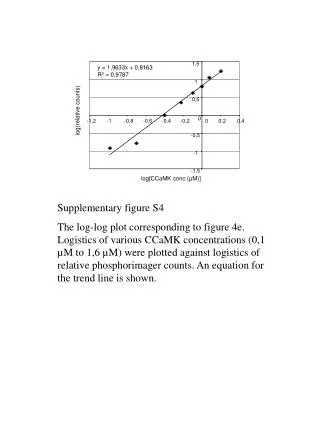
This study presents a log-log plot that examines the relationship between various concentrations of Calcium/Calmodulin-dependent protein kinase (CCaMK) and corresponding relative phosphorimager counts. The concentrations ranged from 0.1 µM to 1.6 µM, showcasing the impact of CCaMK on signal intensity. The trend line is described by the equation ( y = 1.9633x + 0.8163 ) with a high coefficient of determination ( R^2 = 0.9787 ), indicating a strong correlation. Supplementary Figure S4 illustrates these findings, contributing to the understanding of CCaMK's role in cellular signaling.

log[CCaMK conc (µM)]
E N D
Presentation Transcript
1,5 y = 1,9633x + 0,8163 R2 = 0,9787 1 0,5 log(relative counts) 0 -1,2 -1 -0,8 -0,6 -0,4 -0,2 0 0,2 0,4 -0,5 -1 -1,5 log[CCaMK conc (µM)] Supplementary figure S4 The log-log plot corresponding to figure 4e. Logistics of various CCaMK concentrations (0,1 µM to 1,6 µM) were plotted against logistics of relative phosphorimager counts. An equation for the trend line is shown.