Download
1 / 23
240 likes | 248 Views
This presentation discusses the impacts of climate change on Sub-Saharan Africa and explores adaptation strategies. It also introduces the Euro-Mediterranean Center on Climate Change and its divisions.

E N D
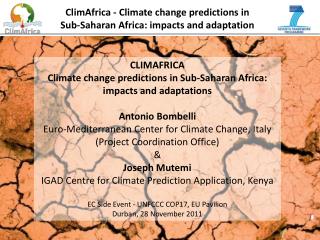
ClimAfrica Climate prediction in Sub-Saharan Africa: Impacts and adaptation WMO Geneva, 26 October 2012 Stefano Materia, Post-Doc Euro Mediterranean Center on Climate Change Climate Service Division
Overview Part 1: CMCC and its divisions Part 2: Climate predictions in Sub-Saharan Africa: Impacts and adaptation
Euro Mediterranean Center on Climate Change • Research Center on Climate Science and Policy • Network of public and private research institutes • Funded by the Italian Ministries: MIUR (University & Research), MATTM (Environment) and MEF (Economy & Finance) • IPCC focal point for Italy MISSION: Investigate and model the climate system and its interaction with society to provide reliable, rigorous, and timely scientific results to stimulate sustainable growth, protect the environment and to develop science-driven adaptation and mitigation policies in a changing climate.
Climate Services (SERC) • Main objectives: • Develop tailored sectorial climate products in a time consistent way, up-to-date and regularly maintained • Establish a discussion and interaction platform with stakeholders • Develop new information systems and tools to support research and dissemination • Activities: • Production of climate predictions and climate change projections (global scale, regional focuses). • Communication of the results and information obtained to a broad range of users: decision makers and stakeholders, political bodies and public administration, researchers from other disciplines. • Coordinate research on adaptation policies to climate change and provide technical and scientific support to the institutions for multilateral negotiation processes in the field of climate change (EU, IPCC, UNFCCC).
Targeted sectors Agriculture Public sector Transports Insurance Tourism Energy
Italian Ministry of Environment: Guidelines for National Adaptation Strategies Venice municipality: Urban planning World Bank: Climate risks on Nigeria’s growth Po River Basin Authority: water management CMCC Climate Service Activities Currently, our major “customers”/stakeholders are large international institutions (e.g., World Bank, …) and national policy makers and institutions (European Union, Italian ministries, regional and local administrations) EU: Climate predictions in the frame of ClimAfrica
Overview Part 1: CMCC and its divisions Part 2: Climate predictions in Sub-Saharan Africa: Impacts and adaptation
Why ClimAfrica? What ClimAfrica? Africa is probably the most vulnerable continents to climate change and climate variability, because of the combination of low adaptive capacity and particular eco-climatic and socio-economic conditions (i.e. sea level rise, flooding, drought, desertification, poverty, conflicts, urbanization, population growth, diseases, etc.). The majority of African population rely on rain fed agriculture. Hence, food production directly depends on climate, making economy and livelihood to be significantly at risk because of climate change. ClimAfrica is conceived to respond to the urgent need for the most appropriate and up-to-date tools to better understand and predict climate variability and change in Africa, assess their impact on ecosystems and population, and develop suited adaptation strategies.
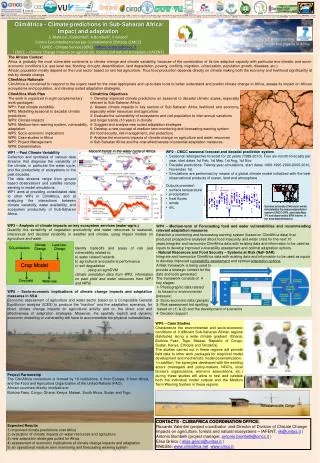
How ClimAfrica? Who ClimAfrica? The ClimAfrica consortium is formed by 18 institutions, 9 from Europe, 8 from Africa, and the Food and Agriculture Organization of the United Nations (FAO). ClimAfrica Work Plan The work is organized in eight complementary work-packages: WP1: Past climate variability WP2: Modelling seasonal to decadal climate predictions WP3: Climate impacts WP4: Medium-term warning system, vulnerability, adaptation WP5: Socio-economic implications WP6: Case studies in Africa WP7: Project Management WP8: Dissemination ClimAfrica Objectives 1- Develop improved climate predictions on seasonal to decadal scales 2- Assess climate impacts in key sectors of Sub-Saharan Africa economy, such as water resources and agriculture 3- Evaluate vulnerability of ecosystems and population to inter-annual climate variations and longer trends (20 years) 4- Suggest and analyse new suited adaptation strategies 5- Develop a new concept of mid-term monitoring and forecasting warning system (for food security, risk management, civil protection).
WP1 - past climate variability Recent trends in the water cycle of Africa Recent trends in the water cycle of Africa WP1 – Past Climate Variability Collection and synthesis of various data streams that diagnose the variability of the climate, in particular the water cycle, and the productivity of ecosystems in the past decades. The data streams range from ground based observations and satellite remote sensing to model simulations. WP1 aims at providing consolidated data to other WPs in ClimAfrica, and at analyzing the interactions between climate variability, water availability, and ecosystem productivity of Sub-Saharan Africa. WP1 – Past Climate Variability Collection and synthesis of various data streams that diagnose the variability of the climate, in particular the water cycle, and the productivity of ecosystems in the past decades. The data streams range from ground based observations and satellite remote sensing to model simulations. WP1 aims at providing consolidated data to other WPs in ClimAfrica, and at analyzing the interactions between climate variability, water availability, and ecosystem productivity of Sub-Saharan Africa. Collection and synthesis of various data that diagnose the climate variability, with particular regard to water cycle, and the productivity of ecosystems in the past decades. The data streams range from ground based observations and satellite remote sensing to model simulations. WP1 provides consolidated data to other WPs in ClimAfrica, and analyses the interactions between climate variability, water availability, and ecosystem productivity of Sub-Saharan Africa. WP1 – Past Climate Variability Collection and synthesis of various data streams that diagnose the variability of the climate, in particular the water cycle, and the productivity of ecosystems in the past decades. The data streams range from ground based observations and satellite remote sensing to model simulations. WP1 aims at providing consolidated data to other WPs in ClimAfrica, and at analyzing the interactions between climate variability, water availability, and ecosystem productivity of Sub-Saharan Africa.
WP2 - Seasonal and decadal prediction system The CMCC Seasonal Prediction System (SPS) Global Model Components Radiative forcing GHGs & SO4 Near-Observational inputs Atmospheric initial conditions Athmosphere Land Surface Ocean initial conditions Sea Ice Ocean The CMCCSeasonal Prediction System is initialised with the “closest to reality” state of the ocean and atmosphere. The model evolves according to both the initial conditions and the physical equations ruling the earth’s system.
WP2 - Seasonal and decadal prediction system • Seasonal retrospective forecast for 22 years (1989-2010). Four six-month lasting simulation per year, starting Feb 1st, May 1st, Aug 1st, Nov 1st. • Decadal predictions. Twenty-year-simulations, start dates 1990-1995-2000-2005-2010, November 1st. Outputs provided: • surface temperature • precipitation • heat fluxes • winds • etc. Surface T anomaly, prediction for autumn 2010
WP3 – Climate impacts on key-ecosystem services (water and agriculture) WP3 – Analysis of climate impacts on key ecosystem services (water-agric.) Quantify the sensitivity of vegetation productivity and water resources to seasonal, interannual and decadal variability in weather and climate, using impact models on agriculture and water WP3 – Analysis of climate impacts on key ecosystem services (water-agric.) Quantify the sensitivity of vegetation productivity and water resources to seasonal, interannual and decadal variability in weather and climate, using impact models on agriculture and water WP3 – Analysis of climate impacts on key ecosystem services (water-agric.) Quantify the sensitivity of vegetation productivity and water resources to seasonal, interannual and decadal variability in weather and climate, using impact models on agriculture and water Quantify the sensitivity of vegetation productivity and water resources to seasonal, interannual and decadal variability in weather and climate, using impact models on agriculture and water Climate Change Land Use Change Identify tradeoffs and areas of risk and vulnerability related to: water related hazards agricultural and pastoral performance soil degradation …using an agroDVM CO2 emissions Identify tradeoffs and areas of risk and vulnerability related to: water related hazards agricultural and pastoral performance soil degradation …using an agroDVM climate simulation data from WP2; information on past yield and water resources from WP1 and WP6) Identify tradeoffs and areas of risk and vulnerability related to: water related hazards agricultural and pastoral performance soil degradation …using an agroDVM climate simulation data from WP2; information on past yield and water resources from WP1 and WP6) Identify tradeoffs and areas of risk and vulnerability related to: water related hazards agricultural and pastoral performance soil degradation …using an agroDVM climate simulation data from WP2; information on past yield and water resources from WP1 and WP6) Crop Model Cropyield Wateruse Separated components of LPJ-GUESS Net echosystem exchange (NEE) for the African continent, derived from the difference between a full LPJ-GUESS landuse simulation and runs with seperate climate components kept constant.
WP4 – Medium-term of Forecasting food and water vulnerabilities and recommending relevant adaptation measures WP3 – Analysis of climate impacts on key ecosystem services (water-agric.) Quantify the sensitivity of vegetation productivity and water resources to seasonal, interannual and decadal variability in weather and climate, using impact models on agriculture and water WP3 – Analysis of climate impacts on key ecosystem services (water-agric.) Quantify the sensitivity of vegetation productivity and water resources to seasonal, interannual and decadal variability in weather and climate, using impact models on agriculture and water WP3 – Analysis of climate impacts on key ecosystem services (water-agric.) Quantify the sensitivity of vegetation productivity and water resources to seasonal, interannual and decadal variability in weather and climate, using impact models on agriculture and water • Task 4.1 • Understand the current dynamics of major food production systems in Africa (and develop a set of conditional vulnerability scenarios based on current agricultural and socio-economic trends to be used to assess impacts • Task 4.2 • Create a Medium Term Warning System considering both “persistent” and “extreme” climate impact factors • Task 4.3 • Identification of options for adaptation to climate change and development and dissemination of planning methods, tools and guides (with WP8) Climate Change Land Use Change CO2 emissions Identify tradeoffs and areas of risk and vulnerability related to: water related hazards agricultural and pastoral performance soil degradation …using an agroDVM climate simulation data from WP2; information on past yield and water resources from WP1 and WP6) Identify tradeoffs and areas of risk and vulnerability related to: water related hazards agricultural and pastoral performance soil degradation …using an agroDVM climate simulation data from WP2; information on past yield and water resources from WP1 and WP6) Identify tradeoffs and areas of risk and vulnerability related to: water related hazards agricultural and pastoral performance soil degradation …using an agroDVM climate simulation data from WP2; information on past yield and water resources from WP1 and WP6) Crop Model Cropyield Wateruse
WP5 – Socio-economic implications of climate change impacts and adaptation in SSA WP3 – Analysis of climate impacts on key ecosystem services (water-agric.) Quantify the sensitivity of vegetation productivity and water resources to seasonal, interannual and decadal variability in weather and climate, using impact models on agriculture and water WP3 – Analysis of climate impacts on key ecosystem services (water-agric.) Quantify the sensitivity of vegetation productivity and water resources to seasonal, interannual and decadal variability in weather and climate, using impact models on agriculture and water WP3 – Analysis of climate impacts on key ecosystem services (water-agric.) Quantify the sensitivity of vegetation productivity and water resources to seasonal, interannual and decadal variability in weather and climate, using impact models on agriculture and water Using a macro-economic, top-down modelling approach, WP5 will assess the economic implication of climate change impacts on agriculture for the SSA economic systems. Impacts will be detailed region wide in term of GDP changes, competitiveness changes, trade flow changes. They will be also specified at the industry level describing production, demand and price shifts. WP5 will also develop a bottom-up analysis, spatially referenced, investigating the potential welfare consequences of climate change impacts on the food system in SSA through its stresses on the livestock sector. Climate Change Land Use Change CO2 emissions Identify tradeoffs and areas of risk and vulnerability related to: water related hazards agricultural and pastoral performance soil degradation …using an agroDVM climate simulation data from WP2; information on past yield and water resources from WP1 and WP6) Identify tradeoffs and areas of risk and vulnerability related to: water related hazards agricultural and pastoral performance soil degradation …using an agroDVM climate simulation data from WP2; information on past yield and water resources from WP1 and WP6) Identify tradeoffs and areas of risk and vulnerability related to: water related hazards agricultural and pastoral performance soil degradation …using an agroDVM climate simulation data from WP2; information on past yield and water resources from WP1 and WP6) Crop Model Cropyield Wateruse
WP6 – Case studies WP3 – Analysis of climate impacts on key ecosystem services (water-agric.) Quantify the sensitivity of vegetation productivity and water resources to seasonal, interannual and decadal variability in weather and climate, using impact models on agriculture and water WP3 – Analysis of climate impacts on key ecosystem services (water-agric.) Quantify the sensitivity of vegetation productivity and water resources to seasonal, interannual and decadal variability in weather and climate, using impact models on agriculture and water WP3 – Analysis of climate impacts on key ecosystem services (water-agric.) Quantify the sensitivity of vegetation productivity and water resources to seasonal, interannual and decadal variability in weather and climate, using impact models on agriculture and water Define environmental and socio-economic conditions of 9 different SSA regions located along a wide climate gradient (Ghana, Burkina Faso, Togo, Malawi, Rep. of Congo, Sudan, Kenya, Ethiopia, Tanzania). The studies carried out in these regions will provide field data to other WPs for empirical model and mechanistic model development. In addition, the synergies developed with the existing actors (managers and policy-makers, NGO’s, local farmer’s organizations, women’s associations, etc.) during these studies will allow to test and validate both the individual model outputs and the Medium Term Warning System in these regions Climate Change Land Use Change CO2 emissions Identify tradeoffs and areas of risk and vulnerability related to: water related hazards agricultural and pastoral performance soil degradation …using an agroDVM climate simulation data from WP2; information on past yield and water resources from WP1 and WP6) Identify tradeoffs and areas of risk and vulnerability related to: water related hazards agricultural and pastoral performance soil degradation …using an agroDVM climate simulation data from WP2; information on past yield and water resources from WP1 and WP6) Identify tradeoffs and areas of risk and vulnerability related to: water related hazards agricultural and pastoral performance soil degradation …using an agroDVM climate simulation data from WP2; information on past yield and water resources from WP1 and WP6) Crop Model Cropyield Wateruse
Expected results WP3 – Analysis of climate impacts on key ecosystem services (water-agric.) Quantify the sensitivity of vegetation productivity and water resources to seasonal, interannual and decadal variability in weather and climate, using impact models on agriculture and water WP3 – Analysis of climate impacts on key ecosystem services (water-agric.) Quantify the sensitivity of vegetation productivity and water resources to seasonal, interannual and decadal variability in weather and climate, using impact models on agriculture and water WP3 – Analysis of climate impacts on key ecosystem services (water-agric.) Quantify the sensitivity of vegetation productivity and water resources to seasonal, interannual and decadal variability in weather and climate, using impact models on agriculture and water Improvement of climate predictions in Africa Evaluation of climate impacts on water resources and agriculture Development of new adaptation strategies suited for Africa Assessment of economic implications of climate change impacts and adaptation Creation of an operational medium term monitoring and a forecasting warning system Climate Change Land Use Change CO2 emissions Identify tradeoffs and areas of risk and vulnerability related to: water related hazards agricultural and pastoral performance soil degradation …using an agroDVM climate simulation data from WP2; information on past yield and water resources from WP1 and WP6) Identify tradeoffs and areas of risk and vulnerability related to: water related hazards agricultural and pastoral performance soil degradation …using an agroDVM climate simulation data from WP2; information on past yield and water resources from WP1 and WP6) Identify tradeoffs and areas of risk and vulnerability related to: water related hazards agricultural and pastoral performance soil degradation …using an agroDVM climate simulation data from WP2; information on past yield and water resources from WP1 and WP6) Crop Model Cropyield Wateruse
Thanks stefano.materia@cmcc.it
Examples of services for the agriculture sector • E-Estimation of crop yield annual changes • F-Fire risk predictions • W-Water balance • C-Change in forests stocks • L-Land capability and sustainability analysis • [-Change in forests stocks and sequestration capacity • I-Impacts of sea-level rise on agriculture/ecosystems • W-Water/air quality analysis • A-Analysis of socio-economic scenarios • --Adaptation to climate change monitoring and evaluation • --Climate proof flood risk management
Autumn 2012 predictions: Precipitation anomalies Precipitation anomalies for Oct-Nov-Dec 2012: This figure shows the precipitation anomalies: the difference between the predicted precipitations and the long term average. Brownish areas are expected to be drier than normal, while blue regions are expected to be wetter than normal. The figure below shows the probability that the anomalies predicted above will occur. Cold colours show areas with high probability of precipitations above average. Warm colours show areas with high probability of precipitations below average.