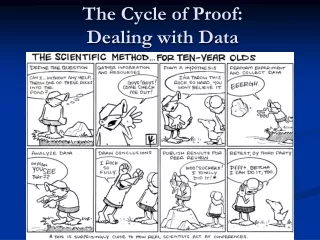

Dealing with Data: Variables and Graphs
E N D
Presentation Transcript
Dealing with Data Skill Chapter 2 St. Stephen’s College F.3 Biology Mr. Tso
One main area of study in science involves carrying out experiments to test hypotheses in order to find out, ‘What happens if ...?’ In experiments many properties can vary, thus the properties are called variables. 1. Variables Variables can conveniently be divided into two main types according to the type of observation: qualitative and quantitative variables.
A. Qualitative variables 1. Variables These are non-numerical variables; they are descriptive, so numbers cannot be attached to them. Examples are colour, shape, behaviour, etc.
B. Quantitative variables 1. Variables When an observation is described by means of a number it must have been counted or measured. Examples are the number of children in families, the number of leaves on plants, the number of heart beats per minute, the weight of students, etc.
In experiments, readings of two variables are obtained. If we were investigating the effect of jumping on the heart beat rate, we would measure the ‘number of jump’ and the ‘heart beat rate’ (number of heart beat per minute). We would naturally vary the ‘number of jump’. Since the ‘number of jump’ variable is decided by you, it is called the independent variable. 2. Relationship between Variables In this experiment the ‘heart beat rate’ is the dependent variable, since the ‘heart beat rate’ is believed to be dependent on the ‘number of jump’.
The table will have at least two columns, the first containing the independent variable and the second the dependentvariable. 3. Tables – the Primary Organization of Data
Independent variable Dependent variable 3. Tables – the Primary Organization of Data 70 85 102 124 132 138 Remember that the units of each of the variables should always be given as far as possible.
In most cases only one set of data is not enough. To obtain more reliable results the heart beat rate should be measured at least three times for each treatment of jumping. Such experimental repetitions are known as replicates. 3. Tables – the Primary Organization of Data
3. Tables – the Primary Organization of Data 70 65 74 97 123 131 133 75 81 101 128 142 143 70 80 100 125 135 138 85 102 124 132 138
In order to make a table self explanatory, it is a good practice to provide a title which usually states out the aim of the experiment. For the above example the following title is suggested: 3. Tables – the Primary Organization of Data
3. Tables – the Primary Organization of Data The effect of jumping on heart beat rate: 70 85 102 124 132 138 65 74 97 123 131 133 75 81 101 128 142 143 70 80 100 125 135 138
Graphs enable us to see trends. There are many different kinds of graphs and this chapter will only cover one of them - line graph. As well as being an excellent means of presenting data, graphs are very useful when it comes to analysing data. 4. Graphs – the Secondary Organization of Data
The following six points should be considered when a graph is drawn: 4. Graphs – the Secondary Organization of Data (1) To allow correction to be made easy during the construction of a graph, always draw in pencil.
The following six points should be considered when a graph is drawn: 4. Graphs – the Secondary Organization of Data (2) The title Every graph should have a title to specify clearly what it represents.
The following six points should be considered when a graph is drawn: 4. Graphs – the Secondary Organization of Data (3) The axes The X axis is reserved for the independent variable and the Y axis for the dependent variable.
The following six points should be considered when a graph is drawn: 4. Graphs – the Secondary Organization of Data (3) The axes ? ?
The following six points should be considered when a graph is drawn: 4. Graphs – the Secondary Organization of Data (4) The scales - consider the range of values on & Y axes - consider to use split scale(s) where necessary
The following six points should be considered when a graph is drawn: 4. Graphs – the Secondary Organization of Data (4) The scales
The following six points should be considered when a graph is drawn: 4. Graphs – the Secondary Organization of Data (5) The points The coordinates of each point can be located by a cross. They can also be located by a point surrounded by a small neat circle. These are illustrated as shown below:
The following six points should be considered when a graph is drawn: 4. Graphs – the Secondary Organization of Data (5) The points
The following six points should be considered when a graph is drawn: 4. Graphs – the Secondary Organization of Data (6) Joining up the points In most cases, the points should be connected by short straight lines as shown below:
The following six points should be considered when a graph is drawn: 4. Graphs – the Secondary Organization of Data (6) Joining up the points
The following six points should be considered when a graph is drawn: 4. Graphs – the Secondary Organization of Data (6) Joining up the points In some cases, a smooth curve (or a straight line) should be drawn. The situations include: (a) a gradual variation of one quantity with the other is obtained by many repeated experiments, OR (b) the graph is used to predict an unknown value.
The following six points should be considered when a graph is drawn: 4. Graphs – the Secondary Organization of Data (6) Joining up the points The following graph shows an example of this kind:
The following shows an example of a well presented graph for reference: 4. Graphs – the Secondary Organization of Data
more example: to investigate the effect of jumping on the heart beat rate of man. 4. Graphs – the Secondary Organization of Data Raw data: Before jumping, the heart beat rate is 70 per minute. Performed 2 units of jumping, HBR is 80 per minute. Performed 4 units of jumping, HBR is 100 per minute. Performed 6 units of jumping, HBR is 125 per minute. Performed 8 units of jumping, HBR is 135 per minute. Performed 10 units of jumping, HBR is 140 per minute.
160 The effect of jumping on heart beat rate 140 x x Heart beat rate (min-1) x 120 100 x 80 x x 60 0 2 4 6 8 10 Number of jump
5. Describing the Relationship of the Two Variables in a Graph A graph may give some idea about the relationship between the variables as shown in the following cases:
Describing a Graph: Case (1) The independent variable in this case is ____________ age. The dependent variable in this case is _________________ number of fingers. Description: The number of fingers is unaffected by age.
Describing a Graph: Case (2) The independent variable in this case is ___________________ amount of water taken. The dependent variable in this case is ___________________ body weight. Description: The body weight of a person increases with the amount of water he taken.
Describing a Graph: Case (3) The independent variable in this case is ____________________ ____________________ amount of urine removed from body. The dependent variable in this case is ___________ body weight. Description: The body weight of a person decreases with the amount of urine removed from him.
Describing a Graph: Case (4) The independent variable in this case is __________________ room temperature. The dependent variable in this case is _____________ rate of sweating. Description: At first the rate of sweating is unaffected by increase in room temperature up to 25oC. After 25oC the rate of sweating increases with room temperature.
Describing a Graph: Case (5) The independent variable in this case is ______ age. The dependent variable in this case is _____________ body height. Description: The body height of David increases with his age up to 18. After 18 years old his body height becomes constant.
Describing a Graph: Case (6) The independent variable in this case is _______________ room temperature. The dependent variable in this case is _______________________ running speed of cockroach. Description: At first the running speed of cockroach increases with room temperature up to 35oC. After 35oC its running speed decreases with further increase in room temperature.
5. Describing the Relationship of the Two Variables in a Graph Remarks: How to describe a graph when the variable of the X axis is time?
5. Describing the Relationship of the Two Variables in a Graph In a time-course experiment, the change in time is not considered the cause of change in the dependent variable. It is better not to say that the dependent variable is affected or not affected by time.
5. Describing the Relationship of the Two Variables in a Graph For example, in measuring the body temperature of an animal within 60 minutes: Statement (1): The body temperature of a cat is unaffected by time.
5. Describing the Relationship of the Two Variables in a Graph For example, in measuring the body temperature of an animal within 60 minutes: Statement (2): The body temperature of the cat is constant from 0 min to 60 min.
5. Describing the Relationship of the Two Variables in a Graph For example, in measuring the body temperature of an animal within 60 minutes: Statement (3): The body temperature of the snake increases from 0 min to 40 min.