Analysis of N-Glycans from NKp30-Ig Constructs via Exoglycosidase Digestions and NP-HPLC
This study investigates the N-glycans from NKp30-Ig constructs produced in CHO, COS, and NSO cells using exoglycosidase digestions. The 2AB-labeled glycan pool was subjected to a series of enzymatic treatments, and the resulting products were analyzed by non-perfusive high-performance liquid chromatography (NP-HPLC). Structural allocations were made based on elution positions measured in glycan units (GU) both pre- and post-digestion, referencing established GU values. The findings provide insights into the glycan structures and their changes based on specific enzymatic treatments.

Analysis of N-Glycans from NKp30-Ig Constructs via Exoglycosidase Digestions and NP-HPLC
E N D
Presentation Transcript
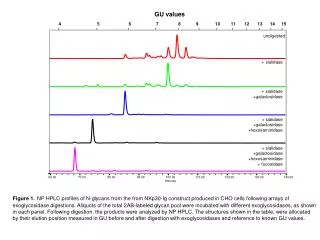
undigested + sialidase + sialidase +galactosidase + sialidase +galactosidase +hexosaminidase + sialidase +galactosidase +hexosaminidase + fucosidase GU values 4 5 6 7 8 9 10 11 12 13 14 15 60.00 70.00 80.00 90.00 100.00 110.00 120.00 130.00 140.00 Minutes Figure 1.NP HPLC profiles of N-glycans from the from NKp30-Ig construct produced in CHO cells following arrays of exoglycosidase digestions. Aliquots of the total 2AB-labeled glycan pool were incubated with different exoglycosidases, as shown in each panel. Following digestion, the products were analyzed by NP HPLC. The structures shown in the table, were allocated by their elution position measured in GU before and after digestion with exoglycosidases and reference to known GU values.
undigested + sialidase + sialidase +galactosidase + sialidase +galactosidase +hexosaminidase + sialidase +galactosidase +hexosaminidase + fucosidase GU values 4 5 6 7 8 9 10 11 12 13 14 15 60.00 70.00 80.00 90.00 100.00 110.00 120.00 130.00 140.00 Minutes Figure 2.NP HPLC profiles of N-glycans from the from NKp30-Ig construct produced in COS cells following arrays of exoglycosidase digestions. Aliquots of the total 2AB-labeled glycan pool were incubated with different exoglycosidases, as shown in each panel. Following digestion, the products were analyzed by NP HPLC. The structures shown in the table, were allocated by their elution position measured in GU before and after digestion with exoglycosidases and reference to known GU values.
undigested + sialidase + sialidase +galactosidase + sialidase +galactosidase +hexosaminidase + sialidase +galactosidase +hexosaminidase + fucosidase GU values 4 5 6 7 8 9 10 11 12 13 14 15 60.00 70.00 80.00 90.00 100.00 110.00 120.00 130.00 140.00 Minutes Figure 3.NP HPLC profiles of N-glycans from the from NKp30-Ig construct produced in NSO following arrays of exoglycosidase digestions. Aliquots of the total 2AB-labeled glycan pool were incubated with different exoglycosidases, as shown in each panel. Following digestion, the products were analyzed by NP HPLC. The structures shown in the table, were allocated by their elution position measured in GU before and after digestion with exoglycosidases and reference to known GU values.
600 500 400 Resonance Units 300 200 100 0 0 2e-7 4e-7 6e-7 8e-7 1e-6 1.2e-6 1.4e-6 1.6e-6 1.8e-6 NKp30-Ig [M] A B Figure 5. (A) Kon (Ka) and Koff (Kd) of NKp30-Ig, NKp46D2-Ig and NKp44-Ig analyzed in the 1:1 langmuir model. (B) Steady State model for CHO-NKp30-Ig. Experiments were performed at a flow rate of 20µl/min in HBS buffer at 25°C. Different analyte concentrations (0, 125, 250, 500, 1000, and 2000 nM) were injected, each followed by regeneration of the surface using 2M NaCl with 20mM NaOH. Association time was 10 min, dissociation time was 3 min. Data processing was done by BIAevaluation software 4.1 using the steady state affinity model. An empty flow cell was used as a control and was subtracted from the responses obtained from the reaction surface. Residuals were below 3.5 RU (below 0.8%) and χ2 was less than 5. The results were expressed in RU against time or RU against concentration. Equilibrium dissociation constant (KD), calculated with BiaEvaluation software 4.1, was 4.08×10⁻⁸ M using the steady state affinity model (χ2 = 4.87).