Download
1 / 23
320 likes | 1.25k Views
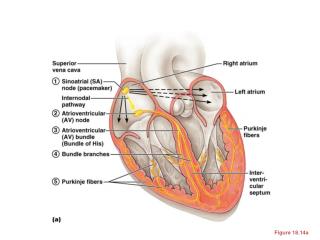
Figure 18.14a. Heart Excitation Related to ECG. SA node generates impulse; atrial excitation begins. Impulse delayed at AV node. Impulse passes to heart apex; ventricular excitation begins. Ventricular excitation complete. SA node. AV node. Bundle branches. Purkinje fibers.

E N D
Heart Excitation Related to ECG SA node generates impulse; atrial excitation begins Impulse delayed at AV node Impulse passes to heart apex; ventricular excitation begins Ventricular excitation complete SA node AV node Bundle branches Purkinje fibers Figure 18.17
SA node generates impulse; atrial excitation begins SA node Figure 18.17
Impulse delayed at AV node AV node Figure 18.17
Impulse passes to heart apex; ventricular excitation begins Bundle branches Figure 18.17
Ventricular excitation complete Purkinje fibers Figure 18.17
Electrocardiography • Electrical activity is recorded by electrocardiogram (ECG) • P wave corresponds to depolarization of SA node • QRS complex corresponds to ventricular depolarization • T wave corresponds to ventricular repolarization • Atrial repolarization record is masked by the larger QRS complex
P – atrial depolarization QRS complex – ventricular depolarization T – ventricular repolarization Normal ECG Signal
ECG Tracings Figure 18.18
Received Graded 100
Electrocardiography Figure 18.16
Heart Sounds • Heart sounds (lub-dup) are associated with closing of heart valves • First sound occurs as AV valves close and signifies beginning of systole • Second sound occurs when SL valves close at the beginning of ventricular diastole
Cardiac Cycle • Cardiac cycle refers to all events associated with blood flow through the heart • Systole – contraction of heart muscle • Diastole – relaxation of heart muscle
Cardiac Output (CO) and Reserve • CO is the amount of blood pumped by each ventricle in one minute • CO is the product of heart rate (HR) and stroke volume (SV) • HR is the number of heart beats per minute • SV is the amount of blood pumped out by a ventricle with each beat • Cardiac reserve is the difference between resting and maximal CO
Cardiac Output: Example • CO (ml/min) = HR (75 beats/min) x SV (70 ml/beat) • CO = 5250 ml/min (5.25 L/min)