Download
1 / 10
100 likes | 188 Views
Discover how American Water, as the largest investor-owned water and wastewater service provider in the U.S., serves millions of people in diverse communities. Learn about their operations, strategic investments, and key industry initiatives.

E N D
American Water At a Glance William D. Rogers April 14, 2011
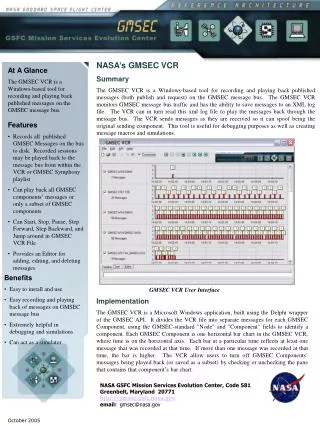
Who We AreWe are the largest investor-owned water and wastewater service provider in the United States. • We serve a broad national footprint and a strong local presence • We provide services to approximately 15 million people in more than 1,600 communities in more than 30 states and parts of Canada • We employ more than 7,000 dedicated and active employees and support ongoing community support and corporate responsibility • We treat and deliver more than one billion gallons of water daily 2
Every day we operate and manage: 49,000 miles of distribution and collection mains And more than: 80 surface water treatment plants 600 groundwater treatment plants 1,000 groundwater wells 60 wastewater treatment plants Where We AreWe manage more than 370 individual water systems across the country 3
Ontario WA MT ME ND VT OR MN NH ID SD NY WI MA CT WY MI RI PA IA NJ NE NV OH MD DE IN IL UT WV CO DC CA KS VA MO KY NC TN AZ OK AR NM SC GA AL MS LA TX AK FL Hawaii American Water’s Regulated Presence 20 regulated states represent nearly 90 percent of American Water’s revenue Note: Numbers may not total due to rounding.
American Water: The Premier Water Services Provider in North America Geographic Diversity (1) Business Diversity (1) • 2010 Revenues • Market data as of 2/9/11 • Market Based includes Other
American Water’s Regulated Portfolio American Water’s Geographic Presence Regulated Customers Total = 3,335,518 Regulated Market Based Net Utility Plant Both Corporate headquarters 2010 EBIT Total = $748 million Total = $11.1 billion 6
Capital Expenditure Plan, by Asset Type: 2011-2013 • $800 - $1 Billion in Capex to be spent each year for the foreseeable future • 20% of Capital Expenditures will be recovered by Infrastructure Surcharge mechanisms * includes Business Transformation capital spend 8
Infrastructure Surcharges: A viable mechanism to address Regulatory Lag • Infrastructure Charges allows companies to recover infrastructure replacement costs without necessity of filing full rate proceeding • States that currently allow use of infrastructure surcharges • Pennsylvania • Indiana • Illinois • Ohio • Surcharges are typically reset to zero when new base rates become effective and incorporate the costs of the previous surcharge investments • Delaware • New York • Missouri (St Louis County) • California - Trial basis 9
Case in point: Increased investment in Pennsylvania’s Infrastructure 10