A Quantitative Literacy Assessment Rubric
220 likes | 354 Views
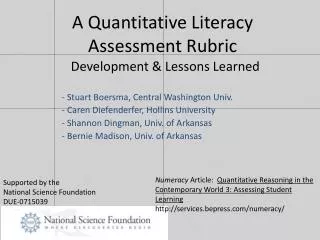
This document discusses the Quantitative Literacy Assessment Rubric developed by Stuart Boersma and colleagues, aiming to measure student learning in quantitative reasoning through case studies. It includes methodologies for utilizing case studies focused on media articles, assessment techniques, and strategies for critiquing quantitative content. The framework is supported by the National Science Foundation and emphasizes core competencies such as critical thinking and problem-solving. Insights into aligning instructional strategies with assessment criteria are also provided to enhance student learning outcomes.

A Quantitative Literacy Assessment Rubric
E N D
Presentation Transcript
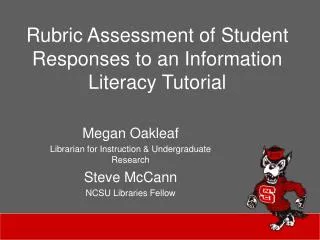
A Quantitative Literacy Assessment Rubric - Stuart Boersma, Central Washington Univ. - CarenDiefenderfer, Hollins University - Shannon Dingman, Univ. of Arkansas - Bernie Madison, Univ. of Arkansas Development & Lessons Learned Numeracy Article: Quantitative Reasoning in the Contemporary World 3: Assessing Student Learning http://services.bepress.com/numeracy/ Supported by the National Science Foundation DUE-0715039
Our Course • Uses case studies centered on one or more media articles • Each case study contains study questions focusing on the quantitative content of the article • Student responses often involve critiquing, analyzing, decision making, and explaining. Making Assessment Difficult!! QRCW Casebook: Case Studies for Quantitative Reasoning: A Casebook of Media Articles, 2nd edition, Pearson Custom Publishing. ISBN13: 978-0-558-19880-0.
A Little History Need: Instrument that we could apply to these non-standard student responses. • AAC&U VALUE Project: • Developed for institutional level assessment (not for grading student work) • 15 areas, 10 of which are termed Intellectual and Practical skills: • Inquiry and analysis, critical thinking, written communication, oral communication, reading, quantitative literacy, information literacy, teamwork, problem solving
Interpretation Representation Calculation Application/Analysis Assumptions Communication
Alignment of QL VALUE Rubric w/ QRCW course Missing Competencies?: • Critical Reading • Number sense • Synthesis Scale • No “zero” • “4” designated capstone achievement; not a consideration for student work in a QL course Folded into “Interpretation” Changed “application/analysis” to “analysis/synthesis” New Scale: 0-3
Use of QL VALUE Rubric in QRCW course Descriptions of achievement levels not objective enough for our uses: Uses quantitative analysis of data as the basis for competent judgments, drawing reasonable conclusions… Uses quantitative analysis of data as the basis for workmanlike judgments, drawing plausible conclusions… Competently converts relevant information into an appropriate and desired mathematical portrayal Skillfully converts relevant information into insightful mathematical portrayal… v v 3 4 3 2
Frequency and Prevalence of Core Competencies in QRCW Casebook
Reliability of QLAR • Focus on Case Study 4.3 • Readers A and B scored questions 3a, 3b, 3c, and 3d on 24 student papers (section 1) • Readers C and D scored 2b, 2c, 2d, 3a, and 3d from 24 papers (section 2)
Reliability Test 1: Readers A and B Disagreement Level Per Core Competency • Overall: • Readers A and B disagreed on 7/238 = 2.94% of assessments. • Average of 7 differences: 1.23
Reliability Test 2: Readers C and D Disagreement Level Per Core Competency • Overall: • Readers C and D disagreed on 15/126 = 11.9% of assessments. • Average of 7 differences: (just over) 1
Added Value of QLAR 1. Allows one to align student prompts with an organized thought process as represented by the rubric To solve a complex problem a student needs to read and glean information, convert the information into a usable form, calculate, make or draw a conclusion, and then communicate the result via explanation. Scaffold student learning by sorting case studies by competency: Start with Interpretation & Representation and build up to more complex prompts. Students often do not recognize these as components of a strong response. Guiding students through mastery of these competencies is crucial!
Added Value of QLAR 2. Improved student prompts. Find out how the Standard & Poor’s 500 stock index is computed. Describe how the Standard & Poor’s 500 stock index is computed. Be sure to differentiate between quantitative information taken directly from the article and extra assumptions you made. Justify any extra assumptions. Use a quantitative argument to…[answer some question] Explain your reasoning!
Interpretation Ability to glean and explain mathematical information presented in various forms (e.g. equations, graphs, diagrams, tables, words) 3 Correctly identifies all relevant information. 2 Correctly identifies some, but not all, relevant information. 1 Some relevant information is identified, but none is correct. 0 No relevant information identified.
Representation Ability to convert information from one mathematical form (e.g. equations, graphs, diagrams, tables, words) into another. 3 All relevant conversions are present and correct. 2 Some correct and relevant conversions are present but some conversions are incorrect or not present. 1 Some information is converted, but it is irrelevant or incorrect. 0 No conversion is attempted
Calculation Ability to perform arithmetical and mathematical calculations. 3 Calculations related to the problem are correct and lead to a successful completion of the problem. 2 Calculations related to the problem are attempted but either contain errors or are not complete enough to solve the problem. 1 Calculations related to the problem are attempted but contain errors and are not complete enough to solve the problem. 0 Calculations given are not related to the problem, or no work is present.
Analysis/Synthesis Ability to make and draw conclusions based on quantitative analysis. 3 Uses correct and complete quantitative analysis to make relevant and correct conclusions. 2 Quantitative analysis is given to support a relevant conclusion but it is either only partially correct or partially complete (e.g. there are logical errors or unsubstantiated claims). 1 An incorrect quantitative analysis is given to support a conclusion. 0 Either no reasonable conclusion is made or, if present, is not based on quantitative analysis.
Assumptions Ability to make and evaluate important assumptions in estimation, modeling, and data analysis. 3 All assumptions needed are present and justified when necessary. 2 At least one correct and relevant assumption is given (perhaps coupled with erroneous assumptions), yet some important assumptions are not present. 1 Attempts to describe assumptions, but none of the assumptions described are relevant. 0 No assumptions present.
Communication Ability to explain thoughts and processes in terms of what evidence is used, how it is organized, presented, and contextualized. 3 A correct and complete explanation is clearly presented. 2 A partially correct relevant explanation is present, but incomplete or poorly presented. 1 A relevant explanation is present, but is illogical, incorrect, illegible, or incoherent. 0 No relevant explanation is provided.