Download

1 / 17
170 likes | 309 Views
Pocket Multi-channel Signal Analyzer. I Introduction Key Features Applications Key Specifications Hardware Connections. Introduction.

E N D
Pocket Multi-channel Signal Analyzer • IIntroduction • Key Features • Applications • Key Specifications • Hardware Connections
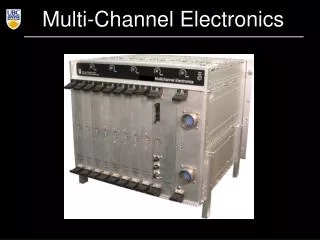
Introduction • The Pocket Multi-Channel Signal Analyzer (PMCSA )is aunique test and measurement instrument .It is designed for applications in electronic,nuclear and optical spectral signal analyzing. • PMCSA is most recently developed by HAL Technology based on the digital signal processing (DSP)technology. A variety of analog input signals can be analyzed fast and accurately. The software shipped with the unit can display the distributions of input signal amplitudes on PC through the high speed USB interface. The data can be acquired in real time and easily stored and printed at the user’s choice. No additional power supply to the unit is needed. • The PMCSA is especially useful for analysis of pulse height and distribution .It can be used with a variety of sensors or transducers. HAL Technology would welcome the customer’s design input to enhance the analyzing capabilities.
Features • Variable Channel up to 16000 • Fast Response • USB interface and real time data acquisitions • Time-domain Signal Display and Analysis • No power supply needed • Free Software and up-gradable
Applications • Pulse Height Analysis of Sensors • Signal Analysis of Sensors • Multi-Channel Analysis
USB Interface Input BNC Connector Input Select Switch Hardware Connections
Software • Introduction • GUI Samples • Key Features • Set up
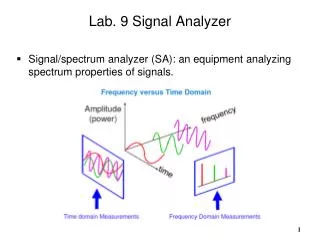
Simple Operation Instructions for MCSA 2.0 The multi-channel signal analyzer software, MCSA Version 2.0, is used together with a MCSA-16000 Pocket Multi-Channel Signal Analyzer purchased. It is compatible with Window operation systems 98/2000/ME/NT/XP. The software has a built-in help and is easy to install and upgradeable. The PMSA Version 2.0 is specially designed for analysis of pulse height and distribution (PHA). The software is easy to use. The users can normally find the function name of each button/icon by placing the mouse pointed at the center of buttons. Both Information Window and Graphics Window provide all the detailed information for the users in direct view. The special feature on Waveform Mode allows users view the time-domain input signal in real time without need of an extra oscilloscope.
Open files in *.cjm and *.cjt format. Save data into the file in *.cjm or *.cjt format Set up the acquisition parameters. Print the current histogram. Help on use of PMSA. Start sampling for either waveform or histogram. Stop sampling. Clear the current displayed histogram. Switch to Histogram mode. Switch to Waveform mode. Calibrate the voltage response of the PMSA. Tool Bar
Acquisition Setting Data is refreshed in real time No data is refreshed in duration acquisition until counting time ended Counting time applies both real-time and duration acquisition.
Instrument Setting Input Signal Maximum Amplitude. It must be consistent with the hardware selection. By selecting Absolute Peak Mode, only falling edge of a pulse reaching the specified baseline value will be counting as a true pulse count. Useful for multipoint smoothing of a noisy pulse envelope By selecting the First-peak mode, a pulse will be counted whenever its falling edge lower the specified value from its peak.
Waveform The actual waveform can be measured using mouse move over
Click Data,Switch to the original data information on channel vs. count General Info window displays most interested information Info Window for Histogram Data can be saved into a file in ASCII format
Thanks for Your Business! HAL Technology Address: 154 S Vista Bonita Avenue Glendora, CA 91741 Tel: (510)579-8540 URL:http://www.haltechnologies.com E-mail:info@haltechnologies.com