Download
1 / 20
200 likes | 310 Views
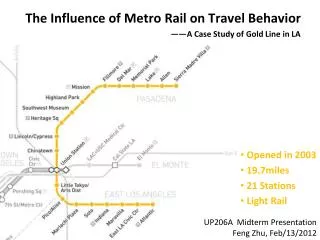
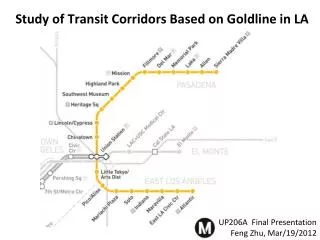
Study of Transit Corridors Based on Goldline in LA. UP206A Final Presentation Feng Zhu, Mar/19/2012. Research Purpose (1) —Midterm Compare travel behavior changes before and after the opening of Goldline .( From 2000 to 2010). Finding:

E N D
Study of Transit Corridors Based on Goldline in LA UP206A Final Presentation Feng Zhu, Mar/19/2012
Research Purpose(1)—Midterm • Compare travel behavior changes before and after the opening of Goldline.(From 2000 to 2010) • Finding: • After the opening of GL, there was slight decrease of Auto-dependence and commuting timewithin station surrounding areas from 2000 to 2010.
Research Purpose(2)—Final • Plan Bus Transit Routes connecting critical transit nodes in Goldlineand surrounding areas, comparing service efficiency of different routes. Goldline Transit Node Main Bus Stop Bus Rapid Route
Step1:Find Nodes Step2:Calculate Transit Need Index Step3:Compare Bus Routes • Three Steps • Use Service Area Analysis to find important transit nodes along Goldline. • Use Hot Spot Analysis to calculate Transit Need Index nearby, and Geocoding main bus stops. • Use OD Cost Matrix and Closest Facility Analysis to plan Bus Rapid Routes, comparing service efficiency in Buffer area along routes.
Step1:Find Nodes Step2:Calculate Transit Need Index Step3:Compare Bus Routes
Step1:Find Nodes Step2:Calculate Transit Need Index Step3:Compare Bus Routes Population in 15 minutes walking distance from Goldline station (1)Union Station:136,138 (2)Highland Park:51,319(3)lake:72,710
Step1:Find Nodes Step2:Calculate Transit Need Index Step3:Compare Bus Routes • Four Factors Influence Transit Need • Population Density • Household Income • % of Under 18 and Above 65 Years • % of No Car Family.
Step1:Find Nodes Step2:Calculate Transit Need Index Step3:Compare Bus Routes
Step1:Find Nodes Step2:Calculate Transit Need Index Step3:Compare Bus Routes • Hot Spot Analysis (Map Algebra) • Population Density(Person/Sq miles) • (1)<10000=1, (2)10000~15000=2, (3)15000~20000=3, 20000~30000=4, (4)>30000=5 • Household Income • (1)<30000=4, (2)30000~50000=3, (3)50000~100000=2, (4)>100000=1 • % of Under 18 and above 65 Years • <15=1, (2)15~25=2, (3)25~40=3, (4)>40=4 • % of No Car Family • <5=1, (2)5~15=2, (3)>15=3 • Transit Need Index=Population Density + Household Income + % of Under 18 and Above 65 Years + % of No Car Family
Step1:Find Nodes Step2:Calculate Transit Need Index Step3:Compare Bus Routes • Modeling Process
Step1:Find Nodes Step2:Calculate Transit Need Index Step3:Compare Bus Routes
Step1:Find Nodes Step2:Calculate Transit Need Index Step3:Compare Bus Routes Five Points Address
Step1:Find Nodes Step2:Calculate Transit Need Index Step3:Compare Bus Routes • Geocoding
Step1:Find Nodes Step2:Calculate Transit Need Index Step3:Compare Bus Routes • Metadata Definition for the Original Data
Step1:Find Nodes Step2:Calculate Transit Need Index Step3:Compare Bus Routes
Step1:Find Nodes Step2:Calculate Transit Need Index Step3:Compare Bus Routes
Conclusion • After the opening of GL, there was slight decrease of Auto-dependence and commuting time within station surrounding areas from 2000 to 2010. • Three Goldline Nodes and Five Transit Need Areas need to be connected by Mass Transit, the most important is from West of LA Downtown to Union Station.
Skills • (1)Inset Map, (2)Point graduated symbol, (3)Creating indices, (4)Attribute sub-sets selection, (5)Boundarysub-sets selection, (6)Geoprocessing, (7)Buffering, (8)Custom shapefile creation, (9)Charts, (10)Hotspot analysis, (11)Geocoding, (12)Network Analysis • Data Source • (1)U.S. Census Bureau:2000 SF3 Sample Data,2010 ACS 5-year estimates. • (2)Metro Developer