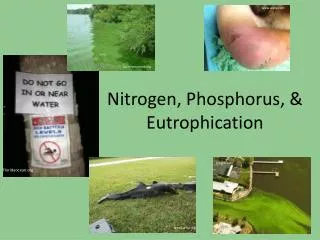
Phosphorus and Nitrogen
380 likes | 1.17k Views
Phosphorus and Nitrogen. Phosphorus. How is P used in organisms? Biomolecules ADP and ATP nucleic acids phospholipids (cell membranes) apatite (bones and tooth enamel) . Forms of Phosphorus. Phosphorus in aquatic systems is usually categorized how we measure it.

Phosphorus and Nitrogen
E N D
Presentation Transcript
Phosphorus How is P used in organisms? • Biomolecules • ADP and ATP • nucleic acids • phospholipids (cell membranes) • apatite (bones and tooth enamel)
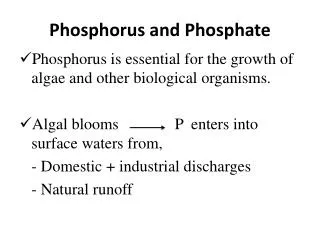
Forms of Phosphorus • Phosphorus in aquatic systems is usually categorized how we measure it. • Dissolved P = Any P that goes through a 0.45um filter • PO43- polyphosphates • Dissolved organic phosphates • Particulate P = Any P that is retained on the filter in algae, zooplankton, detritus, attached to sediment particles. • Total P = Dissolved P + Particulate P • Reactive P = P that reacts with molybdenum to form a blue color. • The most commonly measured forms of P are Total Phosphorus (TP) and Dissolved Reactive Phosphorus (DRP)
Phosphorus and Lake Classification The productivity of a lake is often determined by its P loading and its volume (mean depth)
Limiting nutrient • Theoretically, phosphorus is usually the most limiting nutrient in freshwater systems as determined by Ecological stoichiometry • Ratios of elements in plankton and other organisms
Stoichiometry gives the “recipe” for phytoplankton 2 1/4 cups sifted cake flour2 teaspoons baking powder1/2 teaspoon salt1/2 pound Butter 2 cups sugar4 large egg yolks2 teaspoons vanilla1 cup sour cream4 large egg whites
Recipe for phytoplankton is the Redfield Ratio • In the 1950sAlfred Redfield found in the deep ocean an average phytoplankton composition (by number of atoms) of C H O N P S Fe 106 263 110 16 1 0.7 0.01 Note that C, H, O, and N are required in greater proportion than P. Why then are these NOT the generally nutrient limiting?
C H O N P S Fe 106 263 110 16 1 0.7 0.01 • In freshwater systems P is usually limiting because the amount of P available to primary producers is much less than the amount requiredrelative to the other elements. • P makes up only ~1% of organic matter which implies that if nothing else is limiting, then increasing P can theoretically generate >100X the weight of added P in algae
The Burglar Baker • Suppose you were a baker and wanted to sabotage a rival baker by stealing supplies from his storehouse. You can carry 50 lbs. of any ingredient with you. • What do you steal in order to prevent him from making the most cakes? 2 1/4 cups sifted cake flour2 teaspoons baking powder1/2 teaspoon salt1/2 pound Butter 2 cups sugar4 large egg yolks2 teaspoons vanilla1 cup sour cream4 large egg whites
2 1/4 cups sifted cake flour2 teaspoons baking powder1/2 teaspoon salt1/2 pound Butter 2 cups sugar4 large egg yolks2 teaspoons vanilla1 cup sour cream4 large egg whites i.e. If you have plenty of everything else, then with only ½ teaspoon of salt, you can bake a cake.
Sources of Phosphorus • Weathering of calcium phosphate minerals, especially apatite [Ca5(PO4)3OH] from sediments of ancient oceans. There are no important gaseous sources of P. • Anthropogenic P is now often much greater than natural inputs of P in many watersheds • Sewage, agriculture, etc.
Sources of Phosphorus • Increased production of algae due to increased Anthropogenic P input is cultural eutrophication • Anthropogenic P may come from • point sources (think of a pipe) • nonpoint sources (diffuse, like agriculture runoff)
Point and Nonpoint sources thinkquest.org
External vs. Internal P Loading • “Loading” refers to input of a nutrient per unit time • Usually calculated for rivers as concentration x flow • External loading refers to sources outside the lake (as in previous slide) • If all external sources of P were removed, a lake would continue to grow algae for many years. This is because P is recycled within the lake. This recycling is termed Internal Loading
Lake sediments can trap P under oxic conditions or release P under anoxic conditions Oxygen profile of sediments in oxic conditions Diffusion Barrier P diffusion
Internal P Loading • P may be recycled in the food web several times • Phytoplankton are extemely efficient at absorbing any P that is released by excretion or decomposition • Eventually P will be lost from lake either by outflow or by sedimentation to the lake bottom. • P is bound in lake sediments under oxic conditions, but may be regenerated from sediments under anoxic conditions (iron and microbes play an important role) lakes.chebucto.org/DATA/PARAMETERS/TP/popup.html
Internal P Loading • Deep lakes with oxic hypolimnia and long WRT may retain 70-90% of incoming P in the sediments • Lakes with Anoxic hypolimnia retain only half as much P as lakes with oxic hypolimnia • Therefore external loading may result in a positive feedback loop that amplifies eutrophication. lakes.chebucto.org/DATA/PARAMETERS/TP/popup.html
external P loading phytoplankton regeneration of P from sediments decomposition hypoxia Positive Feedback Loop
Bioturbation With Mayflies Without Mayflies J. Chaffin Physical re-suspension by organisms living in oxic sediments may also increase the regeneration of Phosphorus from sediments into the overlying water
Phosphorus Remediation • Eutrophication can be ugly: high algal biomass (sometimes toxic), hypoxia, fish kills, foul smells • One answer is to reduce P loading by • Removing P from waste water (tertiary treatment) • Diverting waste water (see Lake Washington) • Using natural or constructed wetlands to trap P • Using buffer strips to trap agricultural runoff • Using pumps to aerate the hypolimnion
Wastewater Treatment Addition of alum to precipitate P www.defra.gov.uk
Buffer Strips www.epa.gov/owow/nps/Section319III/OH.htm NRCS
Hypolimnion Aeration content.cdlib.org/xtf/data
The importance of the Maumee River watershed in phosphorus loading to Lake Erie http://web2.uwindsor.ca/lemn/LEMN2010.htm
A look at P in the Maumee River(from P. Richards and D. Baker, NCWQR) Study completed in 1995 showed almost all trends improving, now they are getting worse.
Both river flow and DRP concentration have increased, therefore much greater DRP loading
The Maumee River watershed is causing a high degree of stress to Lake Erie J. Kelly, LEMN Conf. 2010
Where is the dissolved P coming from?Investigation by the Ohio Phosphorus Task Force • Agriculture • Conservation Tillage • Fertilizer remains near the soil surface and is more easily washed into tributaries
Where is the dissolved P coming from?Investigation by the Ohio Phosphorus Task Force • Agriculture • Conservation Tillage • Fertilizer is not incorporated into the soil and is more easily washed into tributaries • Fall application of fertilizers • Continuation of old P-building practice • CAFOS (concentrated animal feeding operations) • Produce large amounts of animal waste with poor waste treatment practices • Municipalities • Combined sewer overflows (CSOs) • Addition of P to water supply as anti-corrosive • See Ohio Lake Erie Phosphorus Task Force Final Report http://www.epa.state.oh.us/portals/35/lakeerie/ptaskforce/Task_Force_Final_Report_April_2010.pdf