1 / 7

Genomic Boundary Prediction Evaluation: Coalescence Point iScan Results

Discussion about Coalescence Point iScan results on predicting genetic boundaries, with analysis of memory usage and running time performance. Initial lab meeting findings reveal only 7 out of 101 predicted genes were correct, with trends of refseq genes crossing boundaries within introns. Notable differences in performance between predicted and reference genes observed.

Download Presentation

Genomic Boundary Prediction Evaluation: Coalescence Point iScan Results

An Image/Link below is provided (as is) to download presentation Download Policy: Content on the Website is provided to you AS IS for your information and personal use and may not be sold / licensed / shared on other websites without getting consent from its author. Content is provided to you AS IS for your information and personal use only. Download presentation by click this link. While downloading, if for some reason you are not able to download a presentation, the publisher may have deleted the file from their server. During download, if you can't get a presentation, the file might be deleted by the publisher.

E N D

Presentation Transcript


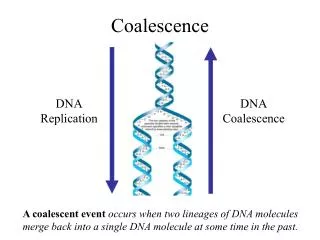
  1. Coalescence Point Iscan Results Lab meeting 12-8-04

  2. Memory Usage

  3. Running Time

  4. Performance

  5. Cp iscan border genes • 91 predicted tx cross 1MB boundaries (437 total boundaries) • 101 refseq tx cross 1MB boundaries • Only 7 correct predicted Txs • The refseqs tend to cross these boundaries in very long introns. • 97 of 101 cross in an intron and the average length is 52477 (refseq average is 4600)

  6. Examples

  7. Differences

More Related