Download
1 / 52
520 likes | 552 Views
Explore causes of severe famine in 1933 Ukraine, analyze demographic data, Soviet statistical system's reliability, and rayon-level indicators. Unveil facts behind the Great Soviet Famine with critical evaluation and historical context.

E N D
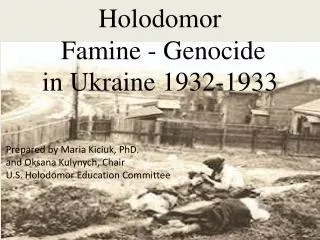
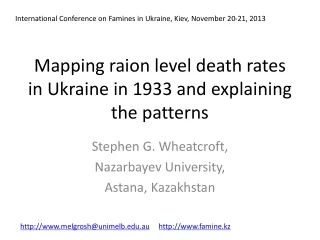
International Conference on Famines in Ukraine, Kiev, November 20-21, 2013 Mapping raion level death rates in Ukraine in 1933 and explaining the patterns Stephen G. Wheatcroft, Nazarbayev University, Astana, Kazakhstan http://www.melgrosh@unimelb.edu.auhttp://www.famine.kz
Do we need to know any more? • Of course we do!
Do we need to know any more? • Of course we do! • I do not think that we currently have a good understanding of the Socio-Economic and Demographic details of what happened and why. • We have a general understanding , but personally I do not think it tells us much.
What and Why? • Why was the famine as serious as it was at a certain time and at a certain place, but not at a different time in a different place. • If we can understand this then we are really explaining something. • Explaining famine in general doesn’t really tell us much.
The famine was worse in Ukraine than in other regions • When? • Not in 1928, or 1929, or 1930 or even in 1931 • Maybe in 1932 and definitely in 1933 • Can we quantify this? • A) Using Mortality rates • B) Using 1939 census age cohort loss
The population of the USSR in 1959 by age and sex Famine 1931-3 Revolution and Civil War 1918 = age 41
Население Республики Казахстан по возрасту и полу в 1939 году источник: РГАЭ, Ф. 1562, оп. 336, д.604, ll. 139-140
Карты смертности от переписи населения 1939 года (потери различных когорт) S.G. Wheatcroft and A. Garnaut
Ежегодные потери когорты (1926-1939) в% от уровня 1927
Can Soviet Statistics of the time give us a reliable indication of reality? • They need to be treated critically. • We need a serious study into how they were constructed and what possible distortions occurred and then what happened.
Problems of objective Evaluations • TsSU/Gosplan SES, TsUNKhU • Strong leadership Popov, 1918-25Osinskii, 1926-8 • Weak leadership Milyutin 1928-9 Gosplan SES, 1930-31 • Strong leadership TsUNKhUOsinskii, 1932-4 • Poor leadership TsUNKhUKraval, 1934-6 • Corrupting influence VoznesenskiiTsKK and then Gosplan
The Great Soviet Famine and Soviet Statistics The Soviet statistical system under Osinskii in 1932-34 was a remarkably fine organization with extraordinarily good statisticians, who tried valiantly to maintain statistical credibility against overwhelming political forces. Their published materials were forced to comply with politically requirements, but internally they attempted to maintain a degree of statistical credibility that does enable us to use their primary data to provide useful indicators of the famines scale and characteristics.
Mapping the famines: Rayon level famine indicators • For the first time we are able to offer you credible rayon level indicators of famine intensity for these great famines. • The Soviet series is based on plotting rayon level mortality indicators that were collected by the Soviet statistical system at the time and were held in secret in the Soviet statistical archives. I will need to explain briefly why I believe them to be reliable.
1) The Soviet statistical data • Monthly conjunctural surveys –very incomplete • Final End of year surveys-much better • There were attempts to force the statisticians to provided missleading data that would under-report urban mortality. • The Statisticians and their leaders were forced to comply, but placed on record, not only their objections, but also the correct (comparable data): • Shavtalov and Kirkevich, Moscow City Statistical Office, July 1934 • Local Ukrainian and Russian statisticians on forms approved by statistical leadership-ultimately Osinskii
Moscow City Statisticians respond to orders to distort figures In agreement with instructions for the annual reworking of the population movement for 1933, in calculating births and deaths in table 1a we are excluding the number of births and deaths of those people from outside the towns and without an address. Before 1933 these people were included To avoid incorrect comparisons the city UNKhU has prepared a table of comparable figures for 1928-1933. Head of Gor UNKhU, Shavtalov Head of Sector of Population and Health, Kirkevich
The rise in mortality (CDR) in Moscow City in comparable and non-comparable terms Comparable figures Requested figures
Kiev Oblast mortality by rayon, 1933 Births of non- residents Deaths of non-residents Births Deaths Population in ZAGS Area
Deaths of non-residents Kiev Oblast 1933 Total for Kiev Oblast Apart from which excluded from towns of Kiev Oblast 2585 7824
List of deaths of non-local (or bezadresnykh) population by month in towns in Kiev Oblast in 1933
Correction • An extra 5 per thousand for 20 million is an extra 100,000
What does the map show? • Very brief and preliminary: • 1. Complex structure of mortality which peaks in a number of regions, which generally cut across oblast boundaries. • Note exception of case of YagodnoPolyanskaya • 2. Ukrainian mortality does not appear to peak in main cherniyedoskiregions or in main areas of centralized grain procurement. More likely in areas of main de-centralized grain procurement
Yasnaya Polyana, enclave of German Autonomous Republic in Saratov Krai, cdr 198%o
Mapping famine mortality in Ukraine • Highest Mortality was not in earliest black board areas, but in Kiev Oblast. • Possible Explanation: • When Ukraine failed to fulfil grain collection plan its allocation of grain was reduced. This led to reductions in urban supplies especially in on-industrial towns and especially in Kiev. • In Kiev collections of grain for the city had to be carried out by decentralized collectors under authority of Kiev obkom and were restricted to Kiev Oblast.
Conclusions • Famine mortality needs to be seen in perspective. • Famine mortality need to be seen in detail. • Mapping the famine helps see it in perspective and detail. • General non-perspective explanations can be used to justify all sorts of claims.
Geography of Surplus regions • 1) Northern Consumer Region ~4 • 2) Southern Consumer Region:ZSFSR/CAsia ~1 • 3) Central Producer Region:CChZ&Volga ~5 • 4) Southern Producer Region: Ukr.& NC ~9 • 5) Eastern Producer Region Urals/Sib/Kaz ~1 1) NCR 3) CPR 4) SPR 4) SPR 3)CPR 5) EPR 5) EPR 2) SCR
Soviet Grain transportation balanceБаланс перевозки зерна
1c) iii) Statistics • Soviet statistical system was built on strengths of Zemstvo statistical system & to some extent maintained part of that tradition. • Popov, 1st Director 1918-1925 • Ossinsky, 2nd Director, 1926-28 Then Collapse under Milyutin 1928-9 & merger into Gosplan SES 1932 Rennaissance in Soviet Statistics –TsUNKhU 1932-4 Osinskii 1st Director, 1932-4 identification of plan constructivist psychology Again partial loss Kraval 2nd Director 1934-7 1939 Popov’s letter to Stalin & Molotov leads to acceptance of reliable population data, despite Voznesenskii Conclusions Secret data, especialy for 1933 much better than expected.