Download
1 / 20
200 likes | 281 Views
Investigating how epigenetic modifications influence gene expression in developing T cells, revealing patterns and associations through experimental techniques.

E N D
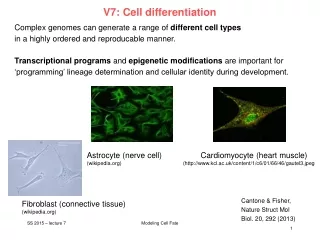
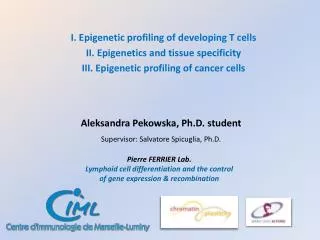
I. Epigenetic profiling of developing T cells II. Epigenetics and tissue specificity III. Epigenetic profiling of cancer cells Aleksandra Pekowska, Ph.D. student Supervisor: Salvatore Spicuglia, Ph.D. Pierre FERRIER Lab. Lymphoid cell differentiation and the control of gene expression & recombination
Epigenetics and Transcription Correlation between a discrete histone modification and the transcriptional state of a given gene Combinatorial patterns of epigenetic modifications and their specific association with the regulation of gene expression throughout cell development. What’s the association of epigenetic patterns with the control of gene expression? Barski et al. Cell 2007
preTCR signalling complex Early T Cell Development (αβ) TCR signalling complex CD4 CD8 CD4 TCR SP SP DP DP preTCR SP SP DP DP pos. selection β selection DN DP CD8 DP SP SP DP DP SP SP TCRα rearrangements Egress from thymus TCRβ rearrangements I.
Experimental Strategy Rag2-/- CD3 Rag2-/- α CD3ε Thymocyte staining: CD8 CD4 DN cells only Passage to DP H3K4me1/me2/me3 H3K36me3 H3K27me3 H3K9me2 T cell custom array (Agilent) -50 - +50 kb from TSS244 k of 60-mers every 300 bp Chromatin extracts: ChIP on chip: Affy arrays: RNA isolation: Whole mm9 annotated transcript list I.
ΔRag (expressed) ΔRag (silent) ΔRagCD3 (expressed) ΔRagCD3 (silent) Results - Overview Expressed Not expressed TSS Gene body H3K36me3 H3K4me1 H3K4me1 H3K4me2 H3K4me2 ΔRag H3K4me3 H3K27me3 H3K4me3 H3K9me2 H3K36me3 H3K36me3 H3K4me1 H3K4me2 H3K27me3 Δ RagCD3 H3K4me3 H3K9me2 H3K27me3 H3K9me2 Cd3d Ebf1 Cd3g Cd3e I. Pekowska et al. In prep
Known Distal Cis - Regulatory Elements H3K36me3 H3K4me1 H3K4me2 ΔRag H3K4me3 H3K27me3 H3K9me2 H3K36me3 H3K4me1 H3K4me2 Δ RagCD3 H3K4me3 H3K27me3 H3K9me2 Cd8a Cd8b1 Dntt - Active Enhancer elements are enriched in H3K4me1/me2 and me3. - Primed enhancer elements are enriched in H3K4me1 and to a lesser extend in H3K4me2 I. Pekowska et al. In prep
% of Eb / pActb % of Eb / pActb ΔRag ΔRag;Eb169 ΔRag ΔRag;Eb169 Tcrb enhancer DRag H3K4me1 DRag;Eb169 DRag H3K4me3 DRag;Eb169 I. Pekowska et al. In prep
The presence of H3K4me3 at distal regulatory regions correlates with adjacent gene expression H3K4me1 domains H3K4me1 domains Repressed Induced % of genes Gained H3K4me2/3 Lost H3K4me2/3 11 ΔRag Gain of H3K4me3 Loose of H3K4me3 ΔRagCD3 10 9 8 log2(expression) Total polII 7 6 5 Spib Klf7 I. Pekowska et al. In prep
Epigenetic Profiles Differ Between Loci Irrespectively of their Expression Level H3K36me3 H3K4me1 H3K4me2 ΔRag H3K4me3 H3K27me3 H3K9me2 H3K36me3 H3K4me1 H3K4me2 Δ RagCD3 H3K4me3 H3K27me3 H3K9me2 Hdac2 Cd8b1 • Is it a global feature? • Do additional epigenetic marks behave in the same way? II.
Cluster 1 Cluster 2 Cluster 3 Cluster 4 Cluster 5 Epigenetic Profiles Depend on the Gene Function H3K4me2 enrichment 0 3 15 Cluster 1 Average tag count log2(expression) Cluster 2 Cluster 3 Distance from TSS (kb) Cluster 4 1 2 3 4 5 Clusters Top GO term and KEGG pathway Cluster 5 Genes -2 0 +8 Benjamini Hochberg corrected p - values Distance from TSS (kb) K. Zhao lab data set (Barski et al. Cell 2007, Wang et al. Nature Genetics 2008) II. Pekowska at al. Genome Research
Epigenetic Profiles Depend on Tissue Expression log2(expression) T cell specificity score T cell specific genes Net # of tissues K. Zhao lab data set (Barski et al. Cell 2007, Wang et al. Nature Genetics 2008) Gene Atlas (http://biogps.gnf.org/) II.
Mouse whole brain data 0 10 30 Cluster 1 Cluster 1 (704 genes) Cluster 2 Cluster 3 Cluster 4 Cluster 5 Cluster 2 (1130 genes) Average tag count Cluster 3 (1417 genes) Distance from TSS (kb) C 0.021 Cluster 4 (2025 genes) < 0.0001 < 0.0001 < 0.0001 log2(expression) Cluster 5 (3153 genes) Genes 1 2 3 4 5 Clusters -2 +8 0 Distance from TSS (kb) II.
Tissue Specific Gene Enriched Cluster 1 Displays a Specific Chromatin Signature Fold change - genes expressed at the same level 0.58 14.34 H3K4me3 polII H2BK5ac H3K27ac H3K4me2 A H3K9me1 H4K20me1 H3K4me1 H3K79me2 H3K79me3 H3K9ac H2BK12ac H3K36ac H4K5ac H3K23ac H3K27me1 H4K8ac B H3K79me1 H2BK120ac K. Zhao lab data set (Barski et al. Cell 2007, Wang et al. Nature Genetics 2008) II. H3K18ac H2BK20ac H3K4ac H4K91ac H3K27me3 H4K20me3 H3K27me2 H3K9me3 H3R2me1 H3R2me2 H3K9me2 H3K36me3 H2AZ C H3K36me1 H3K9ac H3K14ac H4K16ac H4K12ac H2AK5ac -2 0 +8 Distance from TSS (kb)
Tissue Specific Gene Enriched Cluster 1 Displays Statistically Higher Number of Dnase I HSS Number of DHSS per gene 1 2 3 4 5 Clusters Distance from TSS (kb) Number of DHSS per gene Cluster 1 Control Clusters 1 2 3 4 5 Data sets from: Boyle et al. Cell 2008, Gene Atlas (http://biogps.gnf.org/) II.
Cluster 1 Cluster 2 Cluster 3 Cluster 4 Cluster 5 Two Models of Transcriptional Regulation of Expressed Genes Average tag count Distal DHSS Distance from TSS (kb) TFBS DHSS Distal Enhancer Distal Enhancer TFBS DHSS II.
Epigenetic profiling of Acute Myeloblastic Leukaemia (AML) patient’s samples AML Chromosomal aberrations Normal caryotype *ChIP-chip with anti H3K27me3 antibody *Analysis of the data to find some potential aggressiveness markers III.
Acknowledgements Pierre FERRIER Group Salvatore SPICUGLIA TouatiBENOUKRAF Christian CHABANNON’S group Institut Paoli Calmettes Boris CALMELS Sophy LAIBE TAGC Jean Imbert Pierre Cauchy Institut of Immunology, Medical University of Vienna WilfriedEllmeier
ΔRag ΔRagCD3 % of Hprt RT + - + - + - Primer set 1 2 3
Distal Cis - Regulatory Elements H3K36me3 H3K4me1 H3K4me2 ΔRag H3K4me3 H3K27me3 H3K9me2 # of sites for each motif H3K36me3 H3K4me1 H3K4me2 Δ RagCD3 H3K4me3 H3K27me3 Gained H3K4me2/3 Lost H3K4me2/3 H3K9me2 Motif A (SPIB) Fli1 Motif B (Klf7) Ets1 70 kb