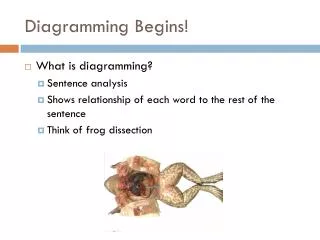
Network Diagramming
Network Diagramming. Network Analysis. The common term for network analysis is PERT PERT stands for Program Evaluation and Review Technique The word PERT, though, has grown to mean network analysis in general. Network Analysis. Goal is to find critical path and bottlenecks.

Network Diagramming
E N D
Presentation Transcript
Network Analysis • The common term for network analysis is PERT • PERT stands for Program Evaluation and Review Technique • The word PERT, though, has grown to mean network analysis in general
Network Analysis • Goal is to find critical path and bottlenecks What is critical path? Those tasks that have the most schedule pressure
Comparison Gantt Chart Milestone Chart
4 6 Terminology and Symbols Event Activity Start Work Sign Contract
Terminology and Symbols Burst Point - Many Tasks Starting when One Finishes
Terminology and Symbols Sink - Many Tasks Finishing before One Can Start
Performing the Analysis • Forward Pass - Working forward through the network to find earliest start and finish times • Backward Pass - Working backward through the network to find latest start and finish times
Earliest Start and Finish Times • The earliest times the tasks can start based on the constraints of the preceding tasks and their relationships to each other. • So, if task A can’t finish till Monday at 5pm, task B can’t start till Monday at 5:01 pm.
Latest Start and Finish Times • The latest times the tasks can start and finish based on the succeeding tasks and the ultimate finish time. • If the contract says the end date for the project is March 11th, then the project has to finish March 11th.
Slack Time • There are two types of slack: • Free slack is float time between tasks based on the relationships of the tasks • Introduced slack is the float time built into the network by contract - this is not in book, but is common in networks, also called total slack
Example 1 C E G A B F D
Calculations • Earliest Start = Latest start from proceeding task • Earliest Finish = Earliest Start + Task Length • Latest Finish = Latest Start from Succeeding Task or Contractual Finish • Latest Start = Latest Finish - Task Length
Forward Pass No Introduced Slack
Example 1 A ES = 1 EF = 1 + 1 = 2 C E G A B F B ES = 2 from A EF = 2 + 3 = 5 D
Example 1 C ES = 5 from B EF = 5 + 4 = 9 C E G A B F D D ES = 5 from B EF = 5 + 3 = 8
Example 1 E ES = 9 from C EF = 9 + 6 = 15 C E G A B F F ES = 15 from E (NOT D) always use latest, earliest finish EF = 15 + 3 = 18 D
Example 1 C E G A B F G ES = 18 from F EF = 18 + 1 = 19 D
Example 1 C E G A B F G LF = 19 LS = 19 - 1 = 18 D
Example 1 E LF = 15 from F LS = 15 - 6 = 9 C E G A B F F LF = 18 from G LS = 18 - 3 = 15 D
Example 1 C LF = 9 from E LS = 9 - 4 = 5 C E G A B F D LF = 15 from F LS = 15 - 3 = 12 D
Example 1 A LF = 2 from B LS = 2 - 1 = 1 C E G A B F B LF = 5 from C (NOT D) Use earliestLatest Start LS = 5 - 3 = 2 D
Critical Path • Critical path (CP) are those tasks with no free slack. So, • LS - ES - introduced slack = 0 • LF - EF - introduced slack = 0
Example 1 Critical path in red. C E G A B F D D has no free slack Critical Path has no free slack
Estimated Times • When combining data for calculating times the best way is: [best time + (4 X Average) + worst) = ML 6 ML = Most likely
Estimated Times • Best time = 14 • Average = 17 • Worst = 28 • [14 + (4 X 17) + 28] = ML = 18.3 or 19