Section 12-3 Two-Way ANOVA
220 likes | 254 Views
Learn about Two-Way Analysis of Variance (ANOVA), a statistical method used with data categorized into two factors. Understand its concepts, requirements, procedures, and interpretation through examples and a software package.

Section 12-3 Two-Way ANOVA
E N D
Presentation Transcript
Section 12-3 Two-Way ANOVA
Key Concepts The analysis of variance procedure introduced in Section 12-2 is referred to as one-way analysis of variance because the data are categorized into groups according to a single factor (or treatment). In this section we introduce the method oftwo-way analysis of variance, which is used with data partitioned into categories according to two factors.
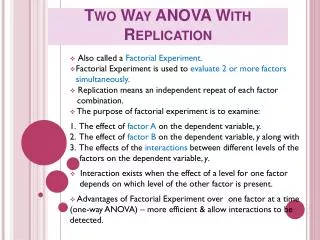
Two-Way Analysis of Variance Two-Way ANOVA involves two factors. The data are partitioned into subcategories called cells.
There is an interaction between two factors if the effect of one of the factors changes for different categories of the other factor. Definition
Example: Let’s explore the data in Table 12-3 by calculating the mean for each cell and by constructing a graph.
Example: The individual cell means are shown in Table 12-4. Those means vary from a low of 36.0 to a high of 47.0, so they appear to vary considerably.
Example: Figure 12-3 is an interaction graph, which shows graphs of those means, and that figure has two very notable features:
Example: Larger means: Because the line segments representing foreign cars are higher than the line segments for domestic cars, it appears that foreign cars have consistently larger measures of chest deceleration. Interaction: Because the line segments representing foreign cars appear to be approximately parallel to the line segments for domestic cars, it appears that foreign and domestic cars behave the same for the different car size categories, so there does not appear to be an interaction effect.
Example: In general, if a graph such as Figure 12-3 results in line segments that are approximately parallel, we have evidence that there is not an interaction between the row and column variables. These observations are largely subjective. Let’s proceed with a more objective method of two-way analysis of variance.
Requirements 1. For each cell, the sample values come from a population with a distribution that is approximately normal. 2. The populations have the same variance 2. 3. The samples are simple random samples. 4. The samples are independent of each other. 5. The sample values are categorized two ways. 6. All of the cells have the same number of sample values.
Technology and Two-Way ANOVA Two-Way ANOVA calculations are quite involved, so we will assume that a software package is being used. Minitab, Excel, TI-83/4 or STATDISK can be used.
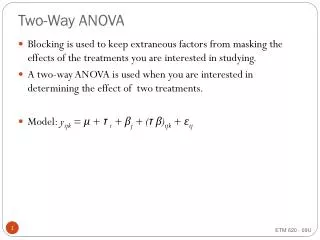
Procedure for Two-Way ANOVA Step 1: Interaction Effect - test the null hypothesis that there is no interaction Step 2: Row/Column Effects - if we conclude there is no interaction effect, proceed with these two hypothesis tests Row Factor: no effects from row Column Factor: no effects from column
Example: Given the chest deceleration measurements in Table 12-3, use two-way analysis of variance to test for an interaction effect, an effect from the row factor of type of car (foreign, domestic), and an effect from the column factor of car size (small, medium, large). Use a 0.05 significance level.
Example: Requirements are satisfied: sample values from normally distributed population; variances vary considerably but not extremely, we’ll keep this in mind; simple random samples; independent samples, not matched; categorized two ways (foreign-domestic, small-medium-large; all cells has same number of samples (3) Here’s the Minitab results:
Example: Step 1: Interaction Effect P-value = 0.717, so fail to reject the null hypothesis of no interaction between the two factors Step 2: Row/Column Effects H0: There is no effect from the row factor (the row means are equal) H0: There is no effect from the column factor (the column means are equal)
Example: Row Factor: P-value = 0.038 < 0.05, so reject the null hypothesis of no effects from the type of car Column Factor: P-value = 0.060 > 0.05, so fail to reject the null hypothesis of no effects from the size of car
Example: Based on the sample data in Table 12-3, we conclude that chest deceleration measurements appear to be affected by whether the car is foreign or domestic, but those measurements do not appear to be affected by the size of the car.
Caution Two-way analysis of variance is not one-way analysis of variance done twice. Be sure to test for an interaction between the two factors.
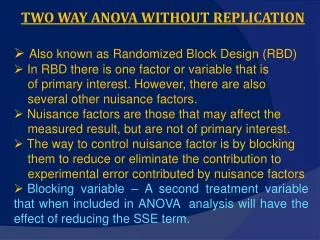
Special Case: One Observation per Cell and No Interaction If our sample data consist of only one observation per cell, we lose MS(interaction), SS(interaction), and df(interaction). If it seems reasonable to assume that there is no interaction between the two factors, make that assumption and then proceed as before to test the following two hypotheses separately: H0: There are no effects from the row factors. H0: There are no effects from the column factors.
Recap In this section we have discussed: • Two- way analysis of variance (ANOVA) • Special case: One observation per cell and no interaction