Download
1 / 52
520 likes | 641 Views
This comprehensive overview examines the multifaceted relationship between energy generation, transportation, and heating, alongside their significant impacts on air, water, and land pollution. It highlights the specific pollutants such as SOx, NOx, PM, and their implications on human health and the environment. Furthermore, it discusses initiatives like Ontario’s Clean Air Plan aimed at reducing emissions and shifting to renewable energy sources, alongside the importance of risk management and public perception in shaping energy policies.

E N D
Energy Use and Pollution The Central Challenge of Our Time Eng Phys EP 3ES3
Energy Modes • Electricity Generation • Transportation • Direct Heating • Industrial Use
Energy Production and Use -Impacts by Environmental Medium • Air –Thermal/Meteorological, Chemical, Radioactive • Water – Chemical, Thermal/Aquatic, Radioactive • Land – Radioactive, Chemical, Bulk Wastes
Air Impacts “Air Pollution” Direct chemical impacts - short and long term “Climate Change” Indirect impacts – long term, global warming/meteorological instability
Air Pollution • SOx • NOx • O 3 • CO • Particulate matter, total, inhalable, respirable • Organics • Metals • Toxics
How Does Poor Air Quality Affect Us? • Human Health Impacts • Odors and Eye Irritation • Poor Visibility and Haze • Property Damage • Community Perception Issues • Direct and Indirect Economic Costs • Damage to Natural Ecosystems
The Problem Health Impacts of Air Pollutants in Hamilton Sahsuvaroglu & Jerrett 2003
Health Impacts in Hamilton – by Air Pollutant Sahsuvaroglu & Jerrett 2003
Traffic Exposure and Myocardial Infarction (Higher Impacts on Women and Over 60s) Exposure to Traffic and the Onset of Myocardial Infarction, A. Peters et al, NEJM, Oct 21, 2004
Level of Exposure to Fine Particulate Matter and the Risk of Death from Cardiovascular Causes in Women Miller KA et al. N Engl J Med 2007;356:447-458
Electricity Generation • Long Range Transport of Air Pollutants
Fossil Fuel Power Plants % of U.S. Total Emissions • 67 % of sulfur dioxide emissions • 23 % of nitrogen oxide emissions • 40 % of man-made carbon dioxide emissions
Ontario Coal Fired Generating Stations – Health Impacts in Ontario • 668 premature deaths, • 928 hospital admissions • 1,100 emergency room visits per year
Risk Management • Hazard • Risk = Hazard x probability • Outrage = Risk perception x hazard • Risk Analysis, including ranking • Risk Management, education/marketing, prioritized actions, review
Ontario's Electricity Generation Mix Fuel Type - Ontario % of Total
Ontario Clean Air Plan for Electricity Generation Close coal-fired generating stations • Reduces greenhouse gas emissions in Canada by up to 30 megatonnes a year • Equivalent to taking seven million cars off the road or removing every car and small truck in Ontario • Meets half of the province’s greenhouse-gas-reduction contributions under the Kyoto Protocol .
Ontario Clean Air Plan for Electricity Generation • Nuclear - Bruce Power refurbish two laid- up nuclear reactors, 1,500 megawatts. • OPG to refurbish existing nuclear facilities at Pickering B. • Limiting the future use of nuclear power to today's installed capacity level of 14,000 megawatts. • Cleaner (Gas Fired) - 7,500 megawatts of cleaner, more diversified power. • Doubling the amount of electricity drawn from renewable sources, bringing the total to 15,700 megawatts by 2025. • Adding $400 M to double the conservation efforts for a total of $550 M, targeting to reduce electricity demand by 6,300 megawatts by 2025. • Expanding the transmission capacity from Bruce County and surrounding area to facilitate the transmission of electricity from several new wind farms and the Bruce facility to Ontario homes and businesses.
Smart Electricity Meters • 800,000 smart meters by December 31, 2007, all Ontario customers by December 31, 2010. • Cost $1Bn • Cost per customer $3-4 per month
Air Pollution Exposures in Hamilton • Long Range Transport + Local Sources • Mobile Monitoring Study to Identify and Rank Local Sources 2005 - 2007
NO ppb Wind
High Pollution Triangle, Samples of Modeled Impacts of Traffic Pollutants, (Julie Wallace, Ph.D. Centre for Spatial Analysis, McMaster University)
NO March 9th 2007 Traffic Traffic Industry Traffic
McMaster Model – Rotek Mobile Data Monitoring/Modeling Interaction
Health Impacts in Hamilton – by Air Pollutant Sahsuvaroglu & Jerrett 2003
Traffic Exposure and Myocardial Infarction (Higher Impacts on Women and Over 60s) Exposure to Traffic and the Onset of Myocardial Infarction, A. Peters et al, NEJM, Oct 21, 2004
Denis Corr, Michael Cho Engineering Physics, McMaster U. Ontario Ministry of Environment An Evaluation of Hybrid Vehicle Use in a Canadian Fleet Environment Honda Insight Toyota Prius
City of Hamilton Analysis Lifetime Cost Comparison5 yr total costs, including lease and fuel
Fuel Economy, Actual, vs. Manufacturer’s Projections • Honda projected Insight to have 50% better fuel economy than Prius, however over 1 year normal fleet operation, fuel economies were comparable.
Drive Clean Emission Testing • MOE Fleet average Drive Clean Test results. • Honda Insight and Toyota Prius Drive Clean Test results.
NuVehicle Program Trend 2002 • Vehicle purchases by organizations, MOE, City of Hamilton, Hamilton Hydro
NuVehicle Program Trend 2006 • Vehicle purchases by organizations, MOE, City of Hamilton, Hamilton Hydro
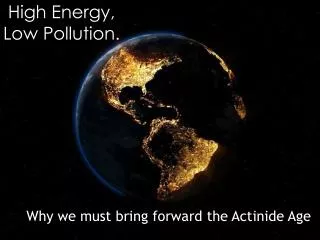
Climate Change • Doesn’t matter where CO2 is released • NOAA index has increased 20% since 1990 • U.S. refuses to sign on to Kyoto agreement • Coal is most abundant/cheapest fossil fuel available