Understanding Wa-Tor World Dynamics through Lotka-Volterra Equations
Learn about animal populations in Wa-Tor World through Lotka-Volterra equations. Discover the predator-prey dynamics graphed over time, as seen in the Hudson Bay Company pelts example.


Understanding Wa-Tor World Dynamics through Lotka-Volterra Equations
E N D
Presentation Transcript
Wa-Tor World Assignment 7 - CS324e
Overview • Visualization - Animal Populations • Description of Wa-Tor World • Demos Wa-tor World
Predator – Prey Equations • a.k.a. Lotka–Volterra equations • x = number of animals that areprey • x = number of predatory animals • = prey population increase (birth rate - death rate) • = rate the predators eat the prey • predator mortality rate • = reproduction rate of predators per 1 prey eaten Wa-tor World
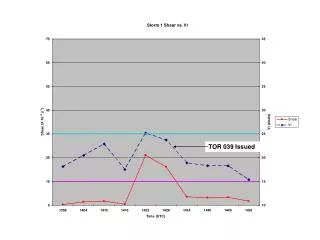
Lotka–Volterraequations • Graphed over time Wa-tor World
Hudson Bay Company - Pelts • Solid line - Rabbits, dashed line - Lynxes Wa-tor World
Wa-tor World Population Wa-tor World
Description of Wa-Tor World • A.K. Dewdney • Computer Recreations column in Scientific America • Sharks and Fish Wage an Ecological War on the Toroidal Planet Wa-Tor Wa-tor World
The World and its Inhabitants Wa-Tor Wa-tor World
The Assignment • Given Simulator • Must implement GUI and controls Population Graphs The World Controls Wa-tor World
Demos • Basic Version • Advanced Controls • Simple Demo inCS324E/A4 folder Wa-tor World
Large Worlds Wa-tor World