Download
1 / 1
10 likes | 128 Views
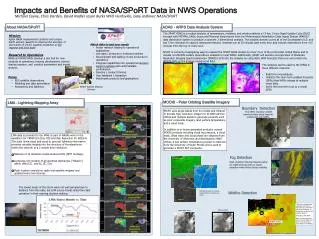
0.5 º SRM. 0.5 º SRM. 1.5 º SRM. 1.5 º SRM. 0.5 º SRM. 0.5 º SRM. 1.5 º SRM. 1.5 º SRM. Minutes before tornado touchdown. Persistent Couplet. Stengthening Couplet. Developing Mesocyclone /Hook. MODIS Night-time Fog Product. 0.5 º Refl. LMA Source Density.

E N D
0.5 º SRM 0.5 º SRM 1.5 º SRM 1.5 º SRM 0.5 º SRM 0.5 º SRM 1.5 º SRM 1.5 º SRM Minutes before tornado touchdown Persistent Couplet Stengthening Couplet Developing Mesocyclone/Hook MODIS Night-time Fog Product 0.5 º Refl LMA Source Density LMA Source Density 0.5 º Refl LMA Source Density 0.5 º Refl 0.5 º Refl LMA Source Density Slight decrease in source count Lightning Jump Continued decrease in sources Minimal Electrical Activity 2240 UTC 2244 UTC 2250 UTC 2234 UTC Impacts and Benefits of NASA/SPoRT Data in NWS Operations About NASA/SPoRT ADAS - ARPS Data Analysis System Mission: Apply NASA measurement systems and unique Earth science research to improve the accuracy of short-term (0-24 hr) weather prediction at the regional and local scale The SPoRT ADAS is a surface analysis of temperature, moisture, and winds combines a 13-km, 2-hour Rapid Update Cycle (RUC) forecast with METARs, SAOs, buoys and Mesonet observations from the Meterological Assimilation Data Ingest System (MADIS) data distribution system to produce a coherent 2-dimensional analysis. The analysis domain covers all of the Southeastern U.S. and has 2-km resolution to capture mesoscale features. Analyses run at 20 minutes past every hour and include observations from ±15 minutes from the top of every hour. SPoRTis currently investigating ways to expand the SPoRT ADAS domain to cover more of the continental United States and to include non-MADIS surface observations available to local WFOs. Additionally, SPoRT will examine incorporation of Moderate Resolution Imaging Spectroradiometer (MODIS) SSTs into the analysis by using NSSL WRF forecasts that soon will contain the MODIS SSTs as the analysis background field. • Match data to end user needs • Foster research leading to operational applications • Link data / products to forecast problems • Development and testing of new products for operations • Integrate capabilities into operational decision support systems and verify/validate performance • Develop / conduct training • User feedback / interaction • Benchmark products and applications • Research to Operations • NASA and NWS WFOs develop a test bed for new products to operations, training development, science sharing sessions, and product assessment and impact analysis. • Focus • EOS satellite observations • Modeling and data assimilation • Nowcasting and lightning Michael Coyne, Chris Darden, David Nadler Jason Burks WFO Huntsville, Gary Jedlovec NASA/SPoRT • The analyses can be used by the WFOs in three different manners: • Real-time mesoanalysis. • Initialize the short-term gridded forecasts (GFEs) that WFOs release at multiple times daily. • Verify the long-term (out to a week) GFEs. SPoRT Science Sharing Seminar MODIS - Polar Orbiting Satellite Imagery LMA – Lightning Mapping Array Boundary Detection 1km 11μm-3.9μm IR SPoRTuses single bands from the visible and infrared to provide high resolution imagery to its NWS partner offices and multiple bands to generate products such as color composite imagery, land surface temperature, and a cloud mask. In addition to in-house generated products, several MODIS products including cloud top pressure, a cloud mask, lifted index and cloud phase are obtained from the University of Wisconsin and distributed to NWS offices. A sea surface temperature product is obtained from the University of South Florida and is used to generate a SPoRT SST composite. The 250m resolution visible bands provides cloud features undetected with GOES. 1km 11μm IR Detailed structure in cloud, temperature, and land use fields • LMA data is provided to the NWS as part of NASA’s work in the validation for TRMM LIS (thru ’09) and Risk Reduction for GOES-R. This total (intra-cloud and cloud to ground) lightning information provides valuable insights into the structure of thunderstorms within the network at a 2 minute time resolution. • Network of 10 detectors centered about HSV (NMT heritage) • Computes 4-D location of all electrical discharges (“flashes”) within LMA (CG…and IC, CC, CA) • Flash location overlaid on radar and satellite imagery and updated every two minutes. 250m VIS Fog Detection High resolution thermal channels allow for night time fog and low clouds detection which limits surface visibility. The lowest levels of the storm were not well sampled due to distance from the radar, but LMA source trends aided the radar operators in their warning decision making. Wildfire Detection “Here's an example from yesterday (the 7th) of how we can use the 88D and 3.9u IR imagery to sense fires during the fire weather season.” Andy Kula, WFO HUN Note: The IR temp was only 27C from GOES (not shown) but showed up much better from MODIS. GOES 1 km Visible MODIS 250m Visible Location of Fire