1 / 0

Brian Voigt, Austin Troy, Brian Miles, Alexandra Reiss University of Vermont – Spatial Analysis Lab

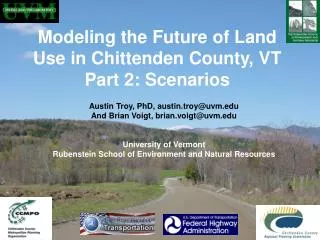
Brian Voigt, Austin Troy, Brian Miles, Alexandra Reiss University of Vermont – Spatial Analysis Lab. What will land use patterns in Chittenden County look like in 20-30 years? What effect will future urban development patterns have on environmental quality?

melosa
Download Presentation

Brian Voigt, Austin Troy, Brian Miles, Alexandra Reiss University of Vermont – Spatial Analysis Lab

An Image/Link below is provided (as is) to download presentation Download Policy: Content on the Website is provided to you AS IS for your information and personal use and may not be sold / licensed / shared on other websites without getting consent from its author. Content is provided to you AS IS for your information and personal use only. Download presentation by click this link. While downloading, if for some reason you are not able to download a presentation, the publisher may have deleted the file from their server. During download, if you can't get a presentation, the file might be deleted by the publisher.

E N D

Presentation Transcript


  1. Brian Voigt, Austin Troy, Brian Miles, Alexandra Reiss University of Vermont – Spatial Analysis Lab
  2. What will land use patterns in Chittenden County look like in 20-30 years? What effect will future urban development patterns have on environmental quality? How might alternative policies alter these outcomes? How can we develop a model framework that effectively integrates the (inter)actions of households, employers, developers, transportation, and the environment? Do indicators of predicted land use change differ depending on whether accessibilities are updated to reflect changing land use?
  3. Integrated Model Framework
  4. YEAR 1930 YEAR 1940 YEAR 1950 YEAR 1960 YEAR 1970 YEAR 1980 YEAR 1990 YEAR 2000 Min = 0.79 per / mi2 Max = 4221 per / mi2 Min = 0.59 per / mi2 Max = 4709 per / mi2 Min = 0.00 per / mi2 Max = 5189 per / mi2 Min = 1.98 per / mi2 Max = 5111 per / mi2 Min = 1.78 per / mi2 Max = 4418 per / mi2 Min = 0.40 per / mi2 Max = 4650 per / mi2 Min = 2.38 per / mi2 Max = 4588 per / mi2 Min = 0.79 per / mi2 Max = 3712 per / mi2
  5. from Waddell, et al, 2003 Model parameters based on statistical analysis of historical data Integrates market behavior, land policies, infrastructure choices Simulates household, employment and real estate development decisions agent-based for household and employment location decisions grid-based for real estate development decisions
  6. Database Output / Indicators Model Coordinator Scenario Data Control Totals TDM Exogenous Data Data-intensive Disaggregated Dynamic Disequilibrium Driven by trends and forecasts
  7. Grid_ID:23674 HSHLD_ID: 23 AGE_OF_HEAD: 42 INCOME: $65,000 Workers: 1 KIDS: 3 CARS: 4 Grid_ID:23674 Households: 9 Non-residential_sq_ft: 30,000 Land_value: 425,000 Year_built: 1953 Plan_type: 4 %_water: 14 %_wetland: 4 %_road: 3 Grid_ID: 60211 Employment_ID: 427 Sector: 2 Employees: 135
  8. Accessibility Accessibility Land Price Land Price Mobility & Transition Mobility & Transition Location Choice Location Choice Real Estate Development Real Estate Development mover vacant units probabilities site selection Residential Land Share Residential Land Share
  9. Accessibility Accessibility Land Price Land Price Mobility & Transition Mobility & Transition Location Choice Location Choice Real Estate Development Real Estate Development Real Estate Development New land development events in response to insufficient supply Residential Land Share Residential Land Share
  10. TransCad 4-step model Developed by RSG, Inc for the CCMPO Run on 5-year interval TDM accounts for changes in land use patterns Calculates accessibility measures and passes results to UrbanSim model
  11. Commercial Feet2 (1,000s) by TAZ No TDM TDM
  12. Commercial Feet2 (1,000s) by TAZ No TDM TDM
  13. No TDM TDM
  14. No TDM – with TDM No clear spatial pattern in the differences
  15. No TDM – with TDM No TDM clusters new residential development in the western portion of the County With TDM clusters new residential development in the eastern portion of the County
  16. Variance Ratio Tests: 2030 Residential Units by TAZ Ho: sd(with TDM / without TDM) = 1 Ha: sd(with TDM / without TDM) ≠ 1 f = 0.6420 Pr(F > f) = 0.0000 Commercial Feet2 by TAZ Ho: sd(with TDM / without TDM) = 1 Ha: sd(with TDM / without TDM) ≠ 1 f =1.0452 Pr(F > f) = 0.6564
  17. No TDM vs RPC housing data Ho: sd(no TDM / RPC) = 1 Ha: sd(no TDM / RPC) ≠ 1 f = 0.9203 Pr(F > f) = 0.2247 With - TDM vs RPC housing data Ho: sd(with TDM / RPC) = 1 Ha: sd(with TDM / RPC) ≠ 1 f = 0.8136 Pr(F > f) = 0.0303
  18. Current implementation of model yields mixed results # of development projects Zoning Continue to explore alternative model specifications Integration with disaggregate travel model
  19. This work was funded by grants from the US DOT – FHWA and the University of Vermont Transportation Research Center UVM UrbanSim team: Brian Miles, Alexandra Reiss Special thanks: Chittenden County MPO & RPC, Dr Adel Sadek and Shan Huang, Resource Systems Group, Inc – Stephen Lawe, John Lobb, and John Broussard For more information www.uvm.edu/envnr/countymodel
  20. Questions??? brian.voigt@uvm.edu University of Vermont Spatial Analysis Lab
  21. 1: proprietary data sets 2: Chittenden County Regional Planning Commission (CCRPC) 3: Chittenden Country Metropolitan Planning Organization (CCMPO)
More Related