Download
1 / 2
20 likes | 152 Views
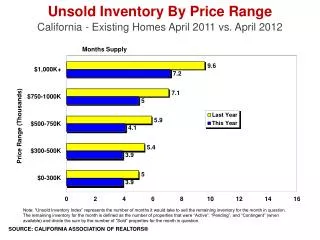
This report compares the unsold inventory of existing homes in California between April 2011 and April 2012. It utilizes the Unsold Inventory Index, which indicates the number of months required to sell the remaining active, pending, and contingent homes. The analysis highlights changes in inventory levels and market conditions over the year, with data sourced from the California Association of Realtors. Understanding these trends aids in gauging the housing market dynamics and future selling potential for homeowners and investors alike.

E N D
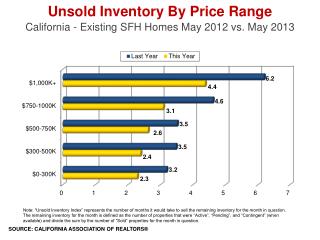
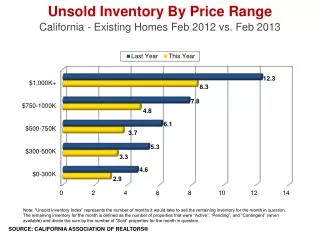
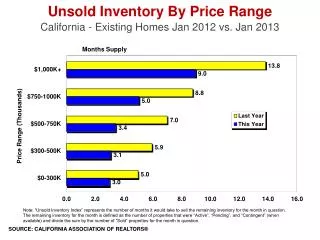
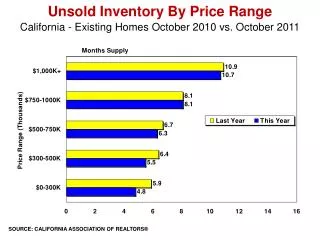
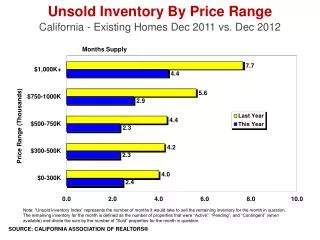
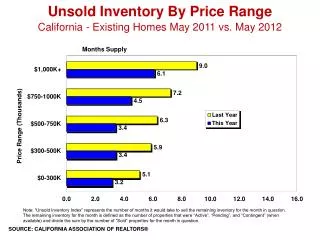
Unsold Inventory By Price Range • California - Existing Homes April 2011 vs. April 2012 Note: “Unsold Inventory Index” represents the number of months it would take to sell the remaining inventory for the month in question. The remaining inventory for the month is defined as the number of properties that were “Active”, “Pending”, and “Contingent” (when available) and divide the sum by the number of “Sold” properties for the month in question. SOURCE: CALIFORNIA ASSOCIATION OF REALTORS®
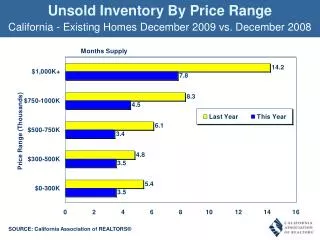
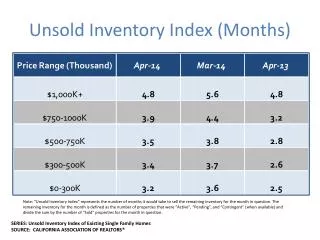
Unsold Inventory Index (Months) Note: The Unsold Inventory Index represents the number of months it would take to deplete the remaining inventory at the end of a particular month with the sales rate of the month in consideration. Inventory includes listings with “Active”, “Pending”, and “Contingent” (when available) statuses. SOURCE: CALIFORNIA ASSOCIATION OF REALTORS®