Download
1 / 80
810 likes | 1.09k Views
Air Pollution and its Impacts on Forests: Knowledge and Challenges. Zhong Chen, Ph.D. Office of Academic Assessment Northern Arizona University Jiangsu Institute of Botany November, 2006. Outline. Why this topic Air pollution-general Acid rain/deposition (SO 2 and NO x )

E N D
Air Pollution and its Impacts on Forests: Knowledge and Challenges Zhong Chen, Ph.D. Office of Academic Assessment Northern Arizona University Jiangsu Institute of Botany November, 2006
Outline • Why this topic • Air pollution-general • Acid rain/deposition (SO2 and NOx) • Ozone (O3) and UV-B • Summary
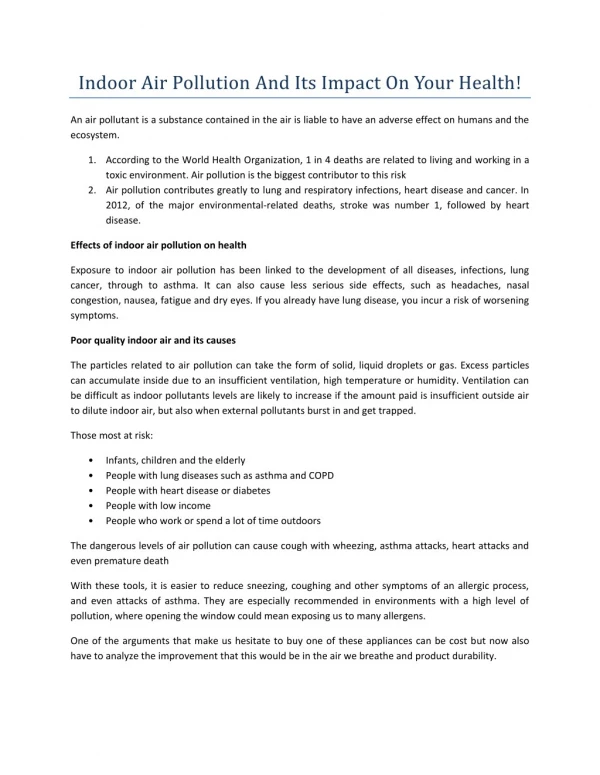
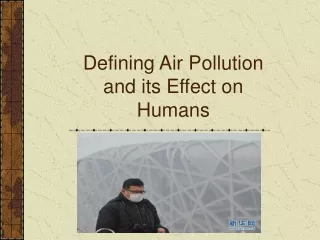
Environmental Challenges in China • 16 of 20 most polluted cities in the world are located in China (World Bank, 2006) • SO2 emission (a major source of acid rain) highest in the world • 2nd largest energy consumer in the world (next to US) • Severe Air, Water, and Soil pollution (close to Western Europe in 1960s) • ¾ urban population exposed to poor air quality (below national standard) • 300,000 premature death in China annually (WHO, 2002) • ¼ of world average in fresh water per capita (about 2,200 m3), limited water resources but overused and highly polluted • Rapid urbanization increased traffic related air pollution and water pollution • Land use change (particularly loss of wetland) and loss of biodiversity Source: Frontiers in Ecology and the Environment, September 2006
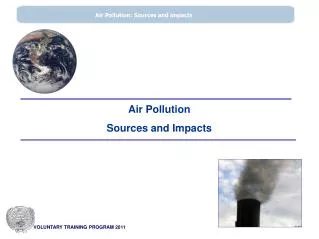
Pollutants • Primary pollutants: directly emitted into the atmosphere through natural and human-related activities as gases, liquid or solid particles (aerosol); deposited onto surface by dry or wet (rain, fog, and hail) deposition • Dry deposition involves diffusion (gases), Brownian motion (fine particles < 2.5 um in diameter), gravitational settling or sedimentation, and impaction (coarse particles > 2.5 um in diam.) • Secondary pollutants: ozone (O3) and sulfate (SO4) particles through radiation and temperature
Human (anthropogenic) activity: fossil combustion including transportation, and biomass burning (e.g. forest fires) • Major natural processes: lightning, soil microbial processes, oxidation of ammonia • Natural processes > human activity in the emission of methane (CH4), and carbon monoxide (CO) , both global warming gases • Human activity > natural processes in global emission of sulfur dioxide (SO2) and oxides of nitrogen (NOx, NO+NO2)-two key pollutants
Sources of air pollution • Stationary -Point- emit air pollutants from one or more controllable sites such as smokestacks of power plants -Fugitive-generate air pollutants from open areas exposed to wind process such as dirty roads, construction sites, farmlands, storage piles, surface mines -Area-emission from a well-defined area and several sources such as small urban community and intense industrialization within urban complex or spray herbicide and pesticide on agricultural areas • Mobile – automobiles, trucks, buses, aircrafts, ships, trains
The Kaiser Aluminum Plant smokestack, behind the Catholic church, belches fumes over the residential area in the Chalmette section, 1973
Pollution from the Jones and Laughlin Steel Corp. at Aliquippa, PA, near Pittsburgh. Some discharge also is made into the Ohio River. The pollution has continued since this picture was taken. Some controlled improvements have been made and additional cleanup efforts have been scheduled, 1973. U.S. National Records Archive.
(China’s Environmental Pollution, National Geographic, March 2004)
Categories of pollutants • Infectious agents (environmentally transmitted infectious diseases via water, air, soil and food) • Toxic heavy metals (mercury, lead, cadmium, nickel, gold, silver, arsenic, selenium, vanadium, chromium…) • Organic compounds • Radiation (nuclear radiation) • Thermal pollution (electric power plants) • Particulates • Asbestos (small, elongated mineral fragments/fibers) • Noise pollution • Electromagnetic fields (electric transmission lines for utilities and appliances) • Light pollution (urban areas particularly)
Major air pollutants • Sulfur dioxide (SO2) • Nitrogen oxides (NOx) • Carbon monoxide (CO) • Photochemical oxidants (ozone, O3) • Hydrocarbons • Hydrogen sulfide (H2S) • Hydrogen fluoride (HF) • Other hazardous gases • Particulate matter (PM) • Asbestos and lead
Sulfur dioxide (SO2): 1) major sources- burning of fossil fuels (e.g. power plants), and industrial processes (petroleum refinery, cement, aluminum, and paper); 2) may be converted to fine particulate sulfate (SO4) through complex reactions; 3) directly results in injury to death of plants and animals, severe damage to respiratory system, precursor of acid rain • Nitrogen oxides (NOx, NO and NO2): 1) nearly all NO2 emitted from anthropogenic sources (automobiles and power plants); 2) converted to ion (NO3–2) within small water particules, impairing visibility; 3) smog, acid rain; 4) human respiratory diseases including influenza (lead to bronchitis and pneumonia); 5) nitrogen fertilization
Carbon monoxide (CO): 1) sources- 90% from natural process (oxidation of natural hydrocarbons, microbial activity in oceans, emissions from plants), 10%-fires, automobiles, incomplete burning of organic compounds); 2) extremely toxic to humans (heart disease, anemia, respiratory diseases) and animals • Photochemical oxidants (PAN (peroxyacyl nitrates) and ozone (O3); 1) sources- human activity (automobile, fossil fuel burning, and industry-produce nitrogen oxides); 2) photochemical smog; 3) hazardous gases to people (eyes and respiratory system); 4) very active chemically, short average life time of cells
Hydrocarbons (CxHy): 1) sources- 80+% from natural process (oxidation of natural hydrocarbons, microbial activity in oceans, emissions from plants), 10%-fires, automobiles; 2) methane (CH4), butane (C4H10), and propane (C3H8)- greenhouse gases; 3) numerous adverse effects to people, plants, and animals through chemical changes • Hydrogen sulfide (H2S) and Hydrogen fluoride (HF): 1) sources- H2S mainly natural process, and HF industry (power plant); 2) both high toxic and corrosive; 3) hazardous gases to people, plants and animals
Particulate matter (PM): 1) construction project-smoke, soot, dust; airborne asbestos; small particles of heavy metals-copper, lead (automobile battery and gasoline) , zinc from industrial facilities; 2) most significant of fine particulate sulfate and nitrates-converted to secondary pollutants (SO4 and NOx)-acid rain; 3) affect human health, ecosystems, and biosphere greenhouse gases (block sunlight may cause changes in climate) gases to people, plants and animals
Atmospheric trace gases that are radiatively active and of significance to global change (EarthQuest 1990) Principal natural sources not included
London Smog In December 1952, air in London became stagnant and cloud over blocked solar radiation Thick fog developed (30F, 80% humidity) Home heating (coal burning-emission of ash, SO2, soot, smoke) + Automobile exhausts About 4,000 people died between Dec. 4-10, 1952 Weather changed and pollution disappeared.
Photochemical smog ------arises mainly from the combustion process by motor vehicles, as well as the increased use of fossil fuels for heating, industry, and transportation. These activities, along with slashing-and-burning of trees and agricultural organic wastes, led to large emissions of two major primary pollutants, volatile organic compounds (VOCs) and nitrogen oxides. Interacting with sunlight, primary pollutants form various hazardous chemicals known as secondary pollutants-namely peroxyacetyl nitrates (PAN) and ground-level (tropospheric) ozone.
Ozone [O3] Peroxyacetyl nitrate (PAN) CH3-CO-ONO2 O2 Sulfur dioxide [SO2] UV light [O] NO2 O Air: Nitrogen 78% Oxygen 21% CO2 0.03% CO2 and CO UV light NO Unburned hydrocarbons Combustion, heat, and pressure Fuel: Hydrocarbons Sulfur contaminant 1-6% Additives (tetraethyllead) Lead (particulate) Plant-pathogenic air pollution resulting from the combustion of fossil fuels (Manion 1991)
Solar radiation Burning coal or oil in an urban area Organic Compounds Hydrocarbons NOx + Sulfur oxides (SOx)+Particulates With stagnant, stable air sufficient relative humidity, cloud cover, and formation of inversion layer and thick fog, lasting several days With presence of an inversion layer, trapping pollutants Concentrated photochemical smog (brown air) Concentrated sulfurous smog (gray air)
Acid rain/deposition • Acid rain encompasses both wet (rain, snow, fog) and dry (particulate) acid deposition that occur near and downwind of areas where major emissions of SO2 and NOx result from burning fossil fuels, pH (1.5-5.6 (“pure rain”)) • Examples of damages: 1) death of thousands of acres of conifer trees in Bavaria, Germany; half of red spruce in Vermont; 2) death of fish in lake ecosystems; 3) human society-steel, paint, masonry, buildings , and considerable health hazards
Sulfur dioxide (SO2) • Major sources- burning of fossil fuels (e.g. power plants), and industrial processes (petroleum refinery, cement, aluminum, and paper) • May be converted to fine particulate sulfate (SO4) through complex reactions • Precursor of acid rain/deposition • Directly results in injury to death of plants and animals, severe damage to respiratory system
SO2 pollution facts • Almost all from fuel burning (electronic power plants), about 20 times natural sulfur emission, unprecedented in geological records • Acid rain, and forming small aerosols with other particulates and moisture • As an environmental threat, since at least 18th century, deleterious effects to lakes, forests, soils etc. have been scientifically documented for at least 30 years • Long-term impacts—predispose trees succumb to insects, diseases, drought, and nutrient stresses
Nitrogen oxides (NOx, NO and NO2) • Nearly all NO2 emitted from anthropogenic sources (automobiles and power plants) • Converted to ion (NO3–2) within small water particules, impairing visibility • Smog, acid rain/deposition • Human respiratory diseases including influenza (lead to bronchitis and pneumonia) • Nitrogen fertilization
Acid neutralizing capacity • Great acid deposition results in increased leaching of base cations (e.g. Ca2+ , Mg2+ , K+, Na+) through acid neutralizing reactions in the soil • Release of base cations: 1) mineral weathering of rocks; 2) cation exchange in soils (e.g. hydrogen ions H+ replaced other cations) • Cation depletion is a cause for concern because of the roles in acid neutralization and importance as essential nutrients • Depletion of base cation and increase aluminum mobilization cause mortality of sugar maples in west and central Pennsylvania
N deposition- too much a good thing • Increased mobile aluminum (Al), which will be toxic to root systems, meaning decreasing symbiotic mycorrhizae fungi and loss of fine root biomass • Reduced ability of taking up water and tolerant to water stresses • Leaching out essential nutrients (Ca, Mg, and K) and decrease tree growth
Acid deposition variations • Elevation : greater amount of deposition in higher elevation than in lower elevation, may not hold true for areas that close to a significant source of air pollution (e.g. close to LA metropolitan areas) • Regions: 1) NE soil developed in most recent glaciations has less ability to absorb sulfate in soil, tend to surface water acidification; 2) SE older non-glacial soils higher capability of absorbing sulfate, surface water acidification does occur; 3) western region in US, California-high N deposition but soil has higher base saturation
Acid deposition variations (cont’d) • Land use: 1) harvesting may deplete soil pools of mineral nutrients-resulting in lower buffering capacity of soil-more susceptible to acid deposition; 2) fires, particularly in severely fire disturbed areas-retain nitrogen deposition for extended period of time • Ecosystem response to acid deposition is nonlinear and case specific!
Pollution-related forest declines of the past 50 years • Widely assumed major role -Massive die-off forests in Europe (Waldsterben) -Decline of ponderosa pine and Jeffery pine in the San Bernardino Mts. of California -Regional decline of white pine in the eastern US and Canada
Pollution-related forest declines of the past 50 years (cont’d) • Possible major role -Decline of red spruce, Balsam and Frasser firs at high elevation in the Appalachian Mts from Georgia to New England -Growth decline without other visible symptoms in loblolly, short leaf, and slash pines in the Piedmont regions of Alabama, Georgia and Carolinas -Widespread dieback of sugar maples in northeastern US and SE Canada
Pollution-related forest declines of the past 50 years (cont’d) • Declines related to biological or physical factors - Decline of oaks in Germany and France since early 1900s - Birch, ash dieback in northeastern US and SE Canada - Maple decline in northeastern US and SE Canada - Littleleaf disease of shortleaf pine in SE US - Oak decline in PA, VA, and TX
Recovery of ecosystems from acidification depends on • The amount of acid deposition (nitrogen and sulfur oxides) • Contribution of natural acidity • Sub-lethal level chronic effects • Depletion of exchangeable base cations (Ca++, Mg++, Na+, K+)
Patterns of major air pollutant change worldwide and impacts on forest ecosystems (Karnosky et al. 2003)
S monitoring and research needs • Monitoring -1) S deposition in countries in transition and in developing countries; 2) continued assessments of impacted forest ecosystems to ensure proper restoration • Forest research -1) methods to mitigate long-term sulfur inputs into soils and to restore sustainable forest ecosystems; 2) effects of S deposition on forest ecosystems, particularly in developing countries
N monitoring and research needs • Monitoring -1) N deposition in countries with rapidly expanding automobile traffic and industry; 2) long-term monitoring of acidification of streams, ponds, and lakes; 3) long-distance transportation and contribution to O3 formation • Forest research -1) Effects of N additions in N-saturated or nearly N-saturated ecosystems; 2) effects of N deposition to ecosystems experiencing other pollutants; 3) effectiveness of various N mitigation treatments on forest soils and watersheds
Ozone is a molecule that contains three atoms of oxygen and thus has the formula O3; Ozone was first discovered in 1839 by German scientist Christian Friedrich Schonbein. (Source: http://www.theozonehole.com/ozone.htm)
(Sources: http://www.theozonehole.com/ozone.htm) Ozone Precursors
Patterns of ozone exposure • Seasonal: summer highest, related to temperature and UV radiation • Diurnal: 1) far from urban areas- concentrations are low in early morning and increase only slightly during mid-afternoon; 2) rural with urban influence-concentrations are low in early morning, increase during the afternoon, and decline at night; 3) urban areas-concentration rise beginning at sunrise, peak by early afternoon and then decrease