Download
1 / 23
230 likes | 339 Views
Explore the critical role of regression modeling in decision-making processes across sectors and industries. Learn from real-world examples and software applications, with a focus on managing risk and optimizing outcomes. Discover the versatility and challenges of regression modeling in various contexts.

E N D
Introduction ofThomas H. Taylor, Jr., PE • Georgia Institute of Technology, BS Applied Mathematics, 1975 • Georgia State University, MS Decision Sciences, Statistics Concentration, 1985 • Registered Professional Engineer, Industrial • 25 years in private-sector energy industry + 8 years in micro-biology and public health, in federal government • Senior Executive in utility consulting industry • Senior federal employee, well published in scientific journals. • Holder of Methods Patent for new computational approach and associated SASTM-based software for series-dilution bioassays • Career conclusions: • Modeling (and much of statistics in general) is transferable across sectors, industries, and disciplines. • The jargon varies across sectors, industries, and disciplines
Presentation Outline • Introduction of T. Taylor • Regression Modeling Motivation • Implicit in the development of a real-world model is the expectation that it be used for decision making. • The decision-making is the guiding principle for model development. • Modeling Examples • Course of Disease – response decisions • Epidemiological, Chronic – policy and treatment decisions • Epidemiological, Outbreak – announcements & recalls • Software for modeling – SASTM is superior to ExcelTM in modeling situations, due to documentation, reproducibility, and audit-worthiness. • Regression modeling in the real world is not as clean as it is in many textbooks
Decision-making and Risk • Implicit in decision making is the minimization of risk • Risk = probability (event) X loss function (event) • Loss functions are different in different industries and sectors • “Risk” is used incorrectly in some sectors and industries. • Government decision criteria are considerably different from private sector • Public welfare is not expected to be cost-effective • Epidemiology • Objective: Reduce burden of disease or rate of mortality • Intervention: Vaccine introduction; educational campaigns, e.g. hand-washing; avoidance of specific behaviors; food and drug recalls • Energy • Objective: reduce energy use, or re-arrange energy use • Actions: green marketing; efficiency mandates; development of alternatives • Classic Marketing • Objective: increase sales; maximize profit; minimize risk • Decisions: pricing, product/service choice; R&D
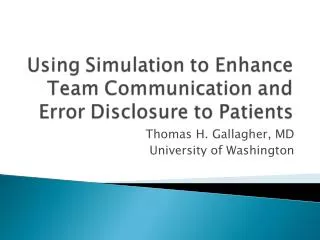
Decision/Outcome Criterion y=x Spore eqiuvalent of toxin level not sick sick Individual tolerance exposure spores
Exposure=Personal Tolerance Fulminant Stage Prodromal Stage
Exposure >> Personal Tolerance Fulminant Stage
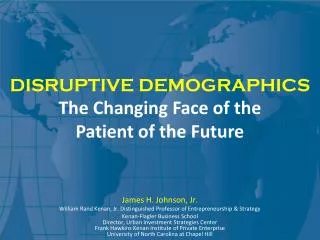
Decision Timepoints (from Model!) 100,000 Not sick 10-11 days to peak toxin level (asymptomatic) Individual tolerance 10-11 days to prodromal disease 50,000 6-7 days till prodromal 4-5 days till prodromal 2-3 days 600 3 hrs. 600 50,000 100,000 exposure
Popular Regression Models • Time series • Simple Trends, e.g. energy increase per year • Application-specific functions, e.g. sigmoidal • ARIMA et al • “Causal” – not really: association ≠ cause • Energy • End-use: BTU=f(appliance stock, efficiency) • Econometric: BTU=f(cost of energy, income, inflation) • Epidemiological • Case-status=f(age, sex, race, genetic factors) • Case-status=f(exposure1, exposure2,…) • “Survival” (Time-to-Event) models
SASTM Regression Procedures • General Regression: The REG Procedure • Nonlinear Regression: The NLIN Procedure • Response Surface Regression: The RSREG Procedure • Partial Least Squares Regression: The PLS Procedure • Regression for Ill-conditioned Data: The ORTHOREG Procedure • Local Regression: The LOESS Procedure • Robust Regression: The ROBUSTREG Procedure • Logistic Regression: The LOGISTIC Procedure • Regression with Transformations: The TRANSREG Procedure • Regression Using the GLM, CATMOD, LOGISTIC, PROBIT, and LIFEREG Procedures • Interactive Features in the CATMOD, GLM, and REG Procedures http://support.sas.com/onlinedoc/913/docMainpage.jsp
SASTM Regression Help (1) • CATMOD • analyzes data that can be represented by a contingency table. PROC CATMOD fits linear models to functions of response frequencies, and it can be used for linear and logistic regression. The CATMOD procedure is discussed in detail in Chapter 5, "Introduction to Categorical Data Analysis Procedures." • GENMOD • fits generalized linear models. PROC GENMOD is especially suited for responses with discrete outcomes, and it performs logistic regression and Poisson regression as well as fitting Generalized Estimating Equations for repeated measures data. See Chapter 5, "Introduction to Categorical Data Analysis Procedures," and Chapter 29, "The GENMOD Procedure," for more information. • GLM • uses the method of least squares to fit general linear models. In addition to many other analyses, PROC GLM can perform simple, multiple, polynomial, and weighted regression. PROC GLM has many of the same input/output capabilities as PROC REG, but it does not provide as many diagnostic tools or allow interactive changes in the model or data. See Chapter 4, "Introduction to Analysis-of-Variance Procedures," for a more detailed overview of the GLM procedure. • LIFEREG • fits parametric models to failure-time data that may be right censored. These types of models are commonly used in survival analysis. See Chapter 10, "Introduction to Survival Analysis Procedures," for a more detailed overview of the LIFEREG procedure. http://v8doc.sas.com/sashtml/
SASTM Regression Help (2) • LOGISTIC • fits logistic models for binomial and ordinal outcomes. PROC LOGISTIC provides a wide variety of model-building methods and computes numerous regression diagnostics. See Chapter 5, "Introduction to Categorical Data Analysis Procedures," for a brief comparison of PROC LOGISTIC with other procedures. • NLIN • builds nonlinear regression models. Several different iterative methods are available. • ORTHOREG • performs regression using the Gentleman-Givens computational method. For ill-conditioned data, PROC ORTHOREG can produce more accurate parameter estimates than other procedures such as PROC GLM and PROC REG. • PLS • performs partial least squares regression, principal components regression, and reduced rank regression, with cross validation for the number of components. http://v8doc.sas.com/sashtml/
SASTM Regression Help (3) • PROBIT • performs probit regression as well as logistic regression and ordinal logistic regression. The PROBIT procedure is useful when the dependent variable is either dichotomous or polychotomous and the independent variables are continuous. • REG • performs linear regression with many diagnostic capabilities, selects models using one of nine methods, produces scatter plots of raw data and statistics, highlights scatter plots to identify particular observations, and allows interactive changes in both the regression model and the data used to fit the model. • RSREG • builds quadratic response-surface regression models. PROC RSREG analyzes the fitted response surface to determine the factor levels of optimum response and performs a ridge analysis to search for the region of optimum response. • TRANSREG • fits univariate and multivariate linear models, optionally with spline and other nonlinear transformations. Models include ordinary regression and ANOVA, multiple and multivariate regression, metric and nonmetric conjoint analysis, metric and nonmetric vector and ideal point preference mapping, redundancy analysis, canonical correlation, and response surface regression. http://v8doc.sas.com/sashtml/
SASTM Regression Help (4) Several SAS/ETS procedures also perform regression. The following procedures are documented in the SAS/ETS User's Guide. • AUTOREG • implements regression models using time-series data where the errors are autocorrelated. • PDLREG • performs regression analysis with polynomial distributed lags. • SYSLIN • handles linear simultaneous systems of equations, such as econometric models. • MODEL • handles nonlinear simultaneous systems of equations, such as econometric models. http://v8doc.sas.com/sashtml/
Point-and-click vs. SASTM code • SASTM has tremendously more capability • Use of SASTM procedures provides documentation, formally and operationally • Spreadsheets and point-and-click environments cannot withstand audits • Regulatory agencies: FERC, FDA, NRC, USDA (FDA: 21 CFR Part 11) • Labor intensive point-and-click can be replaced with SASTM code to save time and, therefore, focus on analysis, not mechanics.
Specific Models • Disease A (used as decision/outcome example above) • Course of disease - NOT regression • Disease P • Time series • Simple periodic with exception!
Seasonal Data with Aberrations 1996 1997 1998 1999
Specific Models • Disease A • Course of disease - NOT regression • Disease P • Time series • Simple periodic with exception! • Sigmoid • Laboratory applications
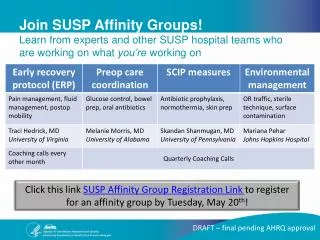
Plot of Measured Response* by Dilution “Well-behaved” Specimen Measured Response *Measured response can be cell counts, optical density, luminescence, or other lab-measured quantity. 100% True Midpoint (LD50, ED50, etc) 0% Observed 50% Titer True 50% Titer Dilution
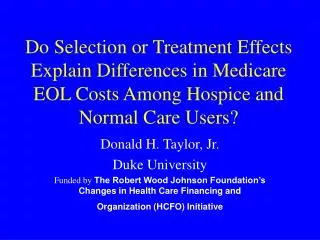
What about?… High-Variance Specimens Robustness of True 50% Endpoint Observed Response Midpoint (50%) Dilution 50%
Specific Models • Disease A • Course of disease - NOT regression • Disease P • Time series • Simple periodic with exception! • Sigmoid • Laboratory applications • Investigation of foodborne disease outbreak • Not a laboratory • Not a controlled experiment • Not even a designed experiment • Observational data
Foodborne Disease Outbreak • Associative (not causal) models • Epidemiological • Case-status=f(exposure1, exposure2,…)
George Box: “…all models are wrong, but some are useful.” • George Edward Pelham Box (18 October 1919 – ) is one of the most influential statisticians of the 20th century and a pioneer in the areas of quality control, time series analysis, design of experiments and Bayesian inference. • He served as President of the American Statistical Association in 1978 and of the Institute of Mathematical Statistics in 1979. He received the Shewhart Medal from the American Society for Quality Control in 1968, the Wilks Memorial Award from the American Statistical Association in 1972, the R. A. Fisher Lectureship in 1974, and the Guy Medal in Gold from the Royal Statistical Society in 1993. He was elected a member of the American Academy of Arts and Sciences in 1974 and a Fellow of the Royal Society in 1979.