Download
1 / 21
210 likes | 401 Views
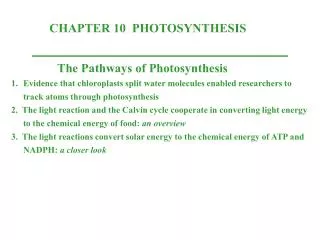
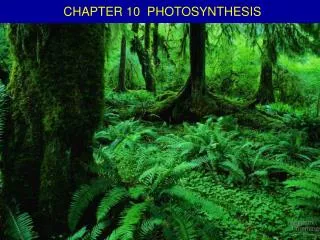
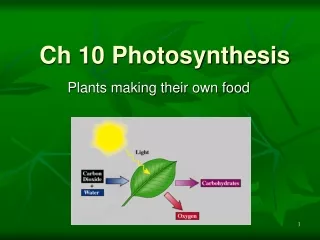
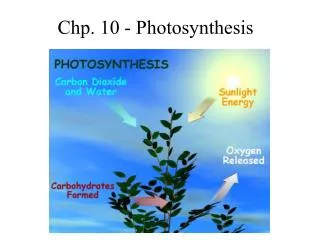
Chp. 10 - Photosynthesis. LE 10-2. Plants. Unicellular protist. 10 µm. Purple sulfur bacteria. 1.5 µm. Multicellular algae. Cyanobacteria. 40 µm. Leaf cross section. Vein. LE 10-3. Mesophyll. Stomata. O 2. CO 2. Mesophyll cell. Chloroplast. 5 µm. Outer membrane. Thylakoid.

E N D
LE 10-2 Plants Unicellular protist 10 µm Purple sulfur bacteria 1.5 µm Multicellular algae Cyanobacteria 40 µm
Leaf cross section Vein LE 10-3 Mesophyll Stomata O2 CO2 Mesophyll cell Chloroplast 5 µm Outer membrane Thylakoid Intermembrane space Thylakoid space Stroma Granum Innermembrane 1 µm
Light LE 10-7 Reflected light Chloroplast Absorbed light Granum Transmitted light
Activity: Light and Pigments 1 m (109 nm) 10–3 nm 103 nm 106 nm 10–5 nm 103 m 1 nm LE 10-6 Gamma rays Micro- waves Radio waves X-rays Infrared UV Visible light 650 750 nm 500 550 600 700 450 380 Shorter wavelength Longer wavelength Higher energy Lower energy
LE 10-8a Refracting prism White light Photoelectric tube Chlorophyll solution Galvanometer 0 100 The high transmittance (low absorption) reading indicates that chlorophyll absorbs very little green light. Green light Slit moves to pass light of selected wavelength
LE 10-8b White light Chlorophyll solution Photoelectric tube Refracting prism 0 100 The low transmittance (high absorption) reading indicates that chlorophyll absorbs most blue light. Slit moves to pass light of selected wavelength Blue light
Chlorophyll a LE 10-9a Chlorophyll b Carotenoids Absorption of light by chloroplast pigments 400 700 500 600 Wavelength of light (nm) Absorption spectra
LE 10-9b Rate of photo- synthesis (measured by O2 release) Action spectrum
LE 10-4 12 H2O 6 CO2 Reactants: 6 O2 6 H2O C6H12O6 Products:
Activity: Overview of Photosynthesis LE 10-5_3 H2O CO2 Light NADP+ ADP + P i CALVIN CYCLE LIGHT REACTIONS ATP NADPH Chloroplast [CH2O] (sugar) O2
e– ATP LE 10-14 e– e– NADPH e– e– e– Mill makes ATP Photon e– Photon Photosystem II Photosystem I
Thylakoid Photosystem STROMA Photon LE 10-12 Light-harvesting complexes Reaction center Primary electron acceptor e– Thylakoid membrane Special chlorophyll a molecules Pigment molecules Transfer of energy THYLAKOID SPACE (INTERIOR OF THYLAKOID)
H2O CO2 Light NADP+ ADP LE 10-13_5 CALVIN CYCLE LIGHT REACTIONS ATP NADPH Electron Transport chain O2 [CH2O] (sugar) Primary acceptor Primary acceptor Electron transport chain Fd e– Pq e– e– e– NADP+ H2O Cytochrome complex 2 H+ + 2 H+ NADP+ reductase + NADPH O2 1/2 Pc e– + H+ P700 Energy of electrons e– Light P680 Light ATP Photosystem I (PS I) Photosystem II (PS II)
H2O CO2 Light NADP+ ADP CALVIN CYCLE LIGHT REACTIONS LE 10-17 ATP NADPH O2 [CH2O] (sugar) STROMA (Low H+ concentration) Cytochrome complex Photosystem I Photosystem II Light NADP+ reductase Light 2 H+ NADP+ + 2H+ Fd NADPH + H+ Pq Pc H2O O2 1/2 THYLAKOID SPACE (High H+ concentration) 2 H+ +2 H+ To Calvin cycle Thylakoid membrane ATP synthase STROMA (Low H+ concentration) ADP + ATP P i H+
Mitochondrion Chloroplast Activity: Light Reactions LE 10-16 CHLOROPLAST STRUCTURE MITOCHONDRION STRUCTURE Diffusion H+ Thylakoid space Intermembrane space Electron transport chain Membrane ATP synthase Key Stroma Matrix Higher [H+] Lower [H+] ADP + P i ATP H+
LE 10-15 Primary acceptor Primary acceptor Fd Fd NADP+ Pq NADP+ reductase Cytochrome complex NADPH Pc Photosystem I ATP Photosystem II
H2O CO2 Input Light (Entering one at a time) 3 NADP+ CO2 ADP CALVIN CYCLE LIGHT REACTIONS LE 10-18_3 ATP Phase 1: Carbon fixation NADPH Rubisco O2 [CH2O] (sugar) 3 P P Short-lived intermediate P 6 3 P P 3-Phosphoglycerate Ribulose bisphosphate (RuBP) 6 ATP 6 ADP 3 ADP CALVIN CYCLE 6 P P 3 ATP 1,3-Bisphosphoglycerate 6 NADPH Phase 3: Regeneration of the CO2 acceptor (RuBP) 6 NADP+ 6 P i P 5 G3P P 6 Activity: Calvin Cycle Glyceraldehyde-3-phosphate (G3P) Phase 2: Reduction 1 P G3P (a sugar) Glucose and other organic compounds Output
LE 10-19 Mesophyll cell Mesophyll cell CO2 PEP carboxylase Photosynthetic cells of C4 plant leaf Bundle- sheath cell The C4 pathway Oxaloacetate (4 C) PEP (3 C) Vein (vascular tissue) ADP Malate (4 C) ATP C4 leaf anatomy Pyruvate (3 C) Bundle-sheath cell CO2 Stoma CALVIN CYCLE Sugar Vascular tissue
LE 10-20 Sugarcane Pineapple CAM C4 CO2 CO2 Night Mesophyll cell CO2 incorporated into four-carbon organic acids (carbon fixation) Organic acid Organic acid Activity: Phtosyn. in Dry Climates Bundle- sheath cell Day CO2 CO2 Organic acids release CO2 to Calvin cycle CALVIN CYCLE CALVIN CYCLE Sugar Sugar Spatial separation of steps Temporal separation of steps
Light reactions Calvin cycle H2O CO2 LE 10-21 Light NADP+ ADP + P i RuBP 3-Phosphoglycerate Photosystem II Electron transport chain Photosystem I ATP G3P Starch (storage) NADPH Amino acids Fatty acids Chloroplast O2 Sucrose (export)