Download

1 / 12
120 likes | 185 Views
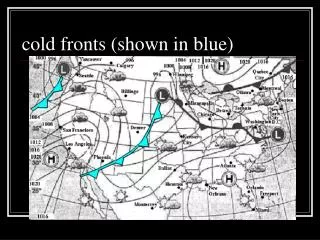
Explore model forecast biases for significant cold fronts in eastern Oklahoma using MOS output data. Analyze errors and biases in pre- and post-frontal temperature predictions from various models. Understand differences between GFS, MET, and ECMWF outputs.

E N D
Analysis of Model Forecasts of Significant Cold Fronts Using MOS Output Steve Amburn, SOO WFO Tulsa, Oklahoma
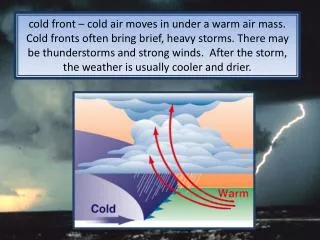
The Question • Does a model bias exist when significant cold fronts move through eastern Oklahoma? • Forecasters say yes. • Too cool ahead of the front • Too warm behind the front
Method • Define significant front (~15°F delta) • Select the frontal cases (over 30) • Use proxies for model data • MAV and MET MOS for periods 1-5 • MEX MOS and ECMWF output for periods 6-13 • Compute applicable statistics
Data • Time period: Oct 2007 through Feb 2009 • Periods 1-5 = 38 Significant Fronts • Periods 6-13 = 35 Significant Fronts • Significant = high temp change ≥ 15°F • Day before to day after frontal passage • MOS data examined • GFS MOS (MAV and MEX) • NAM MOS (MET) • ECMWF (3-hourly max/min output)
Statistics for Periods 1-5 • MAV/GFS • Pre-frontal • Avg bias = -5.31°F • MAE = 6.12°F • # errors to warm = 20 • # errors too cool = 164 • Post-frontal • Avg bias = 4.62°F • MAE = 5.07°F • # errors to warm = 160 • # errors too cool = 19 • MET/NAM • Pre-frontal • Avg bias = -4.42°F • MAE = 5.15°F • # errors to warm = 35 • # errors too cool = 150 • Post-frontal • Avg bias = 2.97°F • MAE = 3.95°F • # errors to warm = 137 • # errors too cool = 34
Statistics for Periods 6-13 • MEX/GFS • Pre-frontal • Avg bias = -9.32°F • MAE = 10.05°F • # errors to warm = 21 • # errors too cool = 256 • Post-frontal • Avg bias = 7.29°F • MAE = 8.03°F • # errors to warm = 240 • # errors too cool = 27 • ECMWF • Pre-frontal • Avg bias = -8.66°F • MAE = 9.70°F • # errors to warm = 24 • # errors too cool = 248 • Post-frontal • Avg bias = 0.89°F • MAE = 6.04°F • # errors to warm = 128 • # errors too cool = 131
Summary for Significant Fronts • GFS and MET for Periods 1-5 • Both have significant cool bias ahead of fronts • Both have significant warm bias behind fronts • GFS and ECMWF for Periods 6-13 • Both have significant cool bias ahead of fronts • GFS has significant warm bias behind fronts • ECMWF showed almost no bias behind fronts
Analysis of Model Forecasts of Significant Cold Fronts Using MOS Output Steve Amburn, SOO WFO Tulsa, Oklahoma 918-832-4115