Download
1 / 20
200 likes | 342 Views
“. Trends in Lake Superior Tributary Flows. Faith Fitzpatrick 1 , Mark Fedora 2 , Stacey Cherwaty-Pergentile 3 , Joan Elias 4 , Robert Dudley 5 , Glenn Hodgkins 5

E N D
“ Trends in Lake Superior Tributary Flows Faith Fitzpatrick1, Mark Fedora2, Stacey Cherwaty-Pergentile3, Joan Elias4 , Robert Dudley5, Glenn Hodgkins5 1U.S. Geological Survey, WI Water Science Center; 2 U.S. Forest Service, Ottawa National Forest; 3Environment Canada, Great Lakes Division; 4 National Park Service, Great Lakes Inventory and Monitoring Network [retired], 5U.S. Geological Survey, ME Water Science Center Lake Superior CSMI, Duluth, MN September 2013
US Geological Survey GLRI Tributary Monitoring Ontonagon St. Louis Bad 30 sites, 3 in Lake Superior watershed
US Geological Survey GLRI Tributary Monitoring Streamflow • 2011-13 Constituents collected: • Streamflow – continuous • Nutrients, chloride, suspended sediment – monthly (plus storms) • Turbidity, temp, pH, DO, conductance -- real-time • 2014+ – reduce to 25 sites, no storms Water Temp Turbidtiy
Available Tributary Monitoring Data Active gauge Inactive gauge
Tributary Flow Trends Study • Goals • Identify basin-wide spatial patterns in trends in streamflow(and water temperature) for Lake Superior tributaries • Describe in relation to climatic patterns (precipitation and temperature) • Application • Lake-wide and tributary management, protection, and conservation policies and programs • Long-term context for chemical loads and trends and impacts on nearshore and lake processes • Base-line for GLRI habitat restoration work • Effects on migratory species and biological integrity Neebing River Gauging Station
Selected Streamgages and Climate Stations Streamflow gauging station Climate station Steel Little Pic White Neebing Pigeon Washington Goulais Tahquamenon Sturgeon Bois Brule Bad U.S. and Canada Binational Land Cover 2000-01 (Hollenhorst et al., in press)
Streamflow Characteristics • Annual mean flows • Annual peak flows • Mean monthly flows • 7-d annual mean low flow • Seasonal winter-spring center of volume date (WSCVD) • 33 Index of Hydrologic Alteration (IHA) metrics (magnitude, duration, frequency, timing, rate of change)
Period of Record • 1921-2009 (Pigeon) • 1945-2009(Pigeon, Brule, Bad, Sturgeon) • 1964-2003 (all 11 U.S. and Canadian gauges) • 1964-2009 (10 U.S. and Canadian gauges, no Washington Cr) • 1980-2009 (10 U.S. and Canadian gauges, no Washington Cr) Photo by Joan Elias Washington Creek, Isle Royale National Park
Nonparametric Statistical Methods • Sen slope (Kendall-Theil robust line) (Helsel and Hirsch, 1992) • Magnitude and direction • Index of Hydrologic Alteration Metrics (Richter et al., 1997) • Two period analyses (1950-1979; 1980-2009) • Range of variability analyses (RVA) • Locally weighted scatterplot smoothing (LOESS)
Annual Precipitation Sen Slope Trends LOESS curves mm Sen slope results • Significant decrease in precipitation especially in the Upper Peninsula of Michigan, over the last 30 years
Annual Mean Flows Pigeon River, Minnesota Sen Slope Trends • Decrease in precipitation mirrored as decrease in annual mean flows across the Lake Superior Basin
Annual 7-Day Low Flows Oronto Creek near Saxon Harbor, WI Sen slope trends Bad River, Wisconsin
Annual Peak Flows Pigeon River 1921-2009 Sen Slope Trends IHA with daily mean data Loess Curve • Last 30 years = more intense rainfalls?
Mean May Air Temperatures and Precipitation Sen slope trends Photo: Lakehead Region Conservation Authority
Timing of Spring Melt * * * * * Sen slope trends * No trend • Last 30 years = less flow in the spring and snowmelt 2-7 days earlier over last 30 years
Water Temperature Washington Creek, Isle Royale Temperature oC May mean Temperature oC July Max
Summary of Tributary Flow Trends 1980-2009 • Annual precipitation decreased by up to 25% • Air temperatures increased • April/May/June flows, annual mean flows, and 7-day low flows have decreased for both U.S. and Canada tributaries • Peak flows have likely increased • Snowmelt happening about 4-7 days earlier for Canada • Water temperatures have likely increased Bad River Lester River
Implications • Fish migration (warmer temps, earlier snowmelt, less flow) • Fish and navigation blockage at rivermouths • Riparian wetlands • Snowmelt Wisconsin State Historical Society • Bank erosion • Ice jams • Wild rice growth • Nutrient/contaminant transport • Effects on nearshore ecological processes Betsie River, Jeff Schaeffer Ontonagon River, Michigan
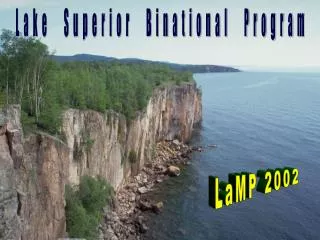
Questions? Funding: Binational Great Lakes Coordinated Science and Monitoring Initiative, Lake Superior Lake-Wide Area Management Plan, Lake Superior Work Group Faith’s contact email: fafitzpa@usgs.gov Lake Superior Binational Program: http://www.epa.gov/glnpo/lakesuperior/