Global Trends in Tertiary Education: A Comparative Analysis of Leading Countries
This analysis examines international statistics on higher education across various countries, focusing on the leading nations based on educational potential and outcomes. It highlights key indicators, such as tertiary education attainment among the 25-to-64 age group, the number of university students, and overall accessibility and affordability of tertiary education. The study identifies twelve leading countries in higher education and discusses the role of global university rankings in assessing national education systems, along with developments in distance education and secondary education quality.

Global Trends in Tertiary Education: A Comparative Analysis of Leading Countries
E N D
Presentation Transcript
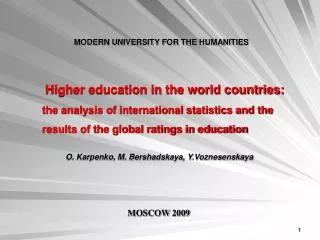
MODERN UNIVERSITY FOR THE HUMANITIES Higher education in the world countries: the analysis of international statistics and the results of the global ratings in education O. Karpenko, M. Bershadskaya, Y.Voznesenskaya МOSCOW 2009
BoundaryConditions for Selection of Leading Countries index of education, describing the educational potential of the population – noless than 0,95 the ratio of 25-to-64-year-olds with tertiary education (level 5A/6)– at least 15% number ofuniversity students (5A/6) – noless than 0,5 million share ofuniversity students (5A/6) in population – noless than 2% 12 leading-countries (only 12 countries out 191 world countries meet these requirements) USA Russia Japan Korea Germany Great Britain France Spain Canada Australia Netherlands Poland TertiaryAttainment of Populationwith regard to the Scale Factor
TERTIARY ATTAINMENT OFPOPULAITION Fig.1 Ratio of 25-to-64-year-olds with tertiary education (level 5A/6) – 2006 Education at a Glance: OECD Indicators – 2008 Edition, table A1.3a
TERTIARY ATTAINMENT OF POPULAITION Fig.2 Distribution of world students population by countries – 2007 Global Education Digest 2009. UNESCO Institute for Statistics.Montreal,2009, table 8
TERTIARY ATTAINMENT OF POPULAITION Fig.3 Share of university students in population – 2007 Calculation by data: 1) Global Education Digest 2009. UNESCO Institute for Statistics.Montreal,2009,table 8 2) Russia and the world countries. 2009. P. 361
The export of education services as a reflection of the existing national education system reputation in the international community World university ratings enabling the evaluation of a national tertiary education system according to integral universities The international study of education quality PISA(Program for International Student Assessment)– shows a state of the secondary school education which is the tertiary education foundation Accessibility and affordability of tertiary education The scope of Distance Education development Only four countries are added to the above mentioned 12 leading countries: India and China, coming out to the forefront due to the number of students in higher education, students growth dynamics and distance education development Finland, leading in three ratings: the quality ofsecondary education PISA-2006, the accessibility and affordability of higher education(2nd place); Sweden- the leader in affordability of higher education Priorities areas of Education Development
EXPORT OF EDUCATION Fig.4 Distribution of foreign students in host countries (in thousands) Global Education Digest 2009. UNESCO Institute for Statistics.Montreal,2009, table 9
Fig.7.. The results of the global rankings on accessibility and affordability of tertiary education. Global rankings of educational opportunities, (proposed by Canadian researchersA. Usher, A. Cervenan ) are based on the separation of the concepts of accessibility of tertiary education and its affordability (ability for payment). Fig.5-7 show the results of the authors project and an approximate estimate ofRussia in these rankings: Fig.5 Place in a ranking on the sum of the weighed values of the indicators characterizing the affordability (ability for payment) of tertiary education; Fig.6 Place in a ranking on the sum of the weighed values of the indicators characterizing the accessibility of tertiary education;
World university rankings Academic Ranking of World Universities (ARWU). F ig.8Academic Ranking of WorldUniversities -2008.http://ed.sjtu.edu.cn/ranking.htm World University Rankings of Times Higher Education Supplement Fig.9 Times Higher Education Supplement http://www.thes.co.uk/
Webometrics Ranking of World Universities Fig.10 Leading countries by the number of universities among the top 5000 world universities Webometrics Ranking of World Universities. http://www.webometrics.info/index.html Fig.11. Distribution of the top 170 Russian Universities in the federal districts. O.Karpenko, M.Bershadskaya,Y.Voznesenskaya. Openness and accessibility of information on the university: results of international ranking of the universities’ web-sites. Workshop on computer science and information technologies CSIT’2009, Crete, Greece, 2009.
Results of international research of school education quality Results PISA (Programme for international student assessment) considered in a context of higher education, have shown the backlog of some countries that have so far been recognized leaders in education (USA, Russia, Spain, France, Germany) – fig.12 Fig.12 Average scores of the countries in the priority area of research PISA-2006 PISA-2006: Science Competencies for Tomorrows World
Consideration of the particularities of the differentiations in the quality of school education within the country reveals its "narrow" places and clearly demonstrates the need for greater openness and accessibility of education to the general population regardless of place of residence – fig.13, 14 Fig.13 The results of American students of different origins: а) average scores, b) deviation from the average score in OECD countries - zero point - the level of OECD countries . а) b) b) а) Fig.14. Theresults of Russian students depending on their place of residence: а) average scores; b) deviation from the average score in OECD countries).
The level of development of distance education based on Information Communication Technologies (ICT) Fig.15 Share of mega-university students in total number of students in the world Fig.16. The role of developing countries in mega-universities Fig.17.Number of mega-universities Fig.18. Number of mega-university students (thousands)
Place among 16 countries-leaders on indicators of system of tertiary education I – index of education, II – the ratio of adults with tertiary education (level, 5A/6). III – number of university students , IV – share of university students in population , V – the ratio of 25-to-64-year-olds with tertiary education (level 5A/5B/6), VI – number of foreign students in host countries, VII – number of national universities among the top world universities (according to cumulative results of three international rating – ARWU, Times and Webometrics), VIII – affordability of tertiary education, IX – accessibility of tertiary education, X – the level of development of distance education, XI -Results of international research of school education quality(according to cumulative results of PISA-2006)
Our address: http://www.muh.ru Thank you for your attention