Download
1 / 34
340 likes | 487 Views
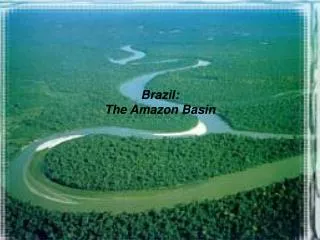
EPUSP Escola Politécnica da Universidade de São Paulo. First Results of GPS data and the contribution for water loading evaluation in Amazon Basin Sonia Maria Alves Costa Ana Cristina Oliveira Cancoro de Matos Jhonnes Vaz Denizar Blitzkow. 2nd LISN Workshop

E N D
EPUSP Escola Politécnica da Universidade de São Paulo First Results of GPS data and the contribution for water loading evaluation in Amazon Basin Sonia Maria Alves Costa Ana Cristina Oliveira Cancoro de Matos Jhonnes Vaz Denizar Blitzkow 2nd LISN Workshop INPE -November 6th – 10th, 2011
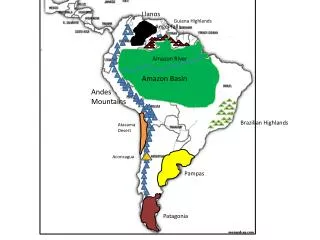
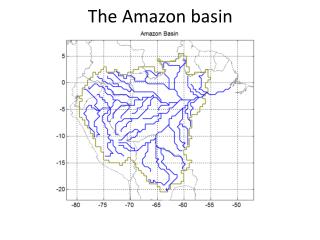
Motivation • Amazon Region has the largest mass variation in the world and one of the most important ecosystems • It is an area with lack of water level information due to difficulties in access for local operations • Climate Protection and Ecosystems Maintenance studies applying new tecnologies and tools • Use the space geodesy in order to provide better knowledge of the lithosphere and the hydrosphere on a global scale
Precipitation Hydrologic Cycle Components Evaporation Evaporation Evapo-transpiration Standard Concepts (Physical) Ocean Infiltration Recharge runoff Aquifer Precipitation Evaporation/ET Surface Water Groundwater source: IWRM & HYDROLOGIC CYCLECOMPONENTS,
Goals • Study the connection between water loading and vertical variations of the crust due to the hydrologic cycle; • Validate GRACE grids of the Ewh and the vertical deflection with in-situ information from gauge and permanent GNSS stations; • Estimate the Lag Time of Crustal Variation and Drought Periods; Period of study:2007 to 2010 In-situ Data Sets 84 gauge stations (Amazon, Tocantins and Paraná basins) 24 GNSS stations Satellite models GRACE mission : Land Water Storage and Vertical Deflection
GRACE Satellite Mission – Gravity Recovery and Climate ExperimentTime-variable gravity fields Launched : March, 2002 Goal: detailed measurements of Earth's gravity field which lead to discoveries about gravity and Earth's natural systems
Data sets • In-situ water level measurements provided by Agência nacional de Águas(ANA) from 84 hidrological stations in Amazon, Tocantins and Paraná Basins . Informations and data available at: http://hidroweb.ana.gov.br/. • 10-day GRACE data geoid solutions expressed in Stokes coefficients up to degree 50 (i.e., ~450 km spatial resolution) corrected from atmospheric (ECMWF) and ocean tides (MOG-2D). Computed by GRGS (Groupe Recherche de Geodesie Spatiale) Informations and data available at: http://bgi.cnes.fr:8110/geoid-variations. • Global Navigation Satellite Systems (GNSS) data from 24 continuous monitoring stations of Instituto Brasileiro de Geografía e Estatística (IBGE), Low-Latitude Ionospheric Sensor Network (LISN), Serviço Geológico Brasileiro and International GNSS Service (IGS). Informations and dataavailable at: ftp://geoftp.ibge.gov.br (RBMC) http://lisn.igp.gob.pe/ (LISN) ftp://igscb.jpl.nasa.gov (IGS)
Region of Study with Basins/Sub-basins and Station distribution
GNSS Data Analysis Position time series The position time series of stations were obtained from the daily double difference solutions (1461 solutions) processed with Bernese software. Each daily solution was aligned to the weekly IGS05 solutions applying minimum constraint strategy. The IGS05 stations used for the reference frame definition were: AREQ, BRFT, CHPI, CRO1, KOUR, LPGS, MANA, RIOP, SCUB and UNSA. Daily position evaluation The time series transformation parameters between daily solutions and IGS05 weekly solutions are estimated in order to check the external fit of daily results. The RMS for the north (N), east (E) and up (U) components to be 1.4, 1.5 and 5.6 mm. Data Problems Noisy data mainly in L2 observable (LETI, JIPA and TEFE) Problems with satellite clocks New sites for SREM and PARI
Peak to peak variation of vertical component The highest values occur between october and november when the ebb period is finishing and rivers have the lowest water level. The lowest values of vertical component occur between april and may when the rain season is finishing and rivers are full of water (flood period).
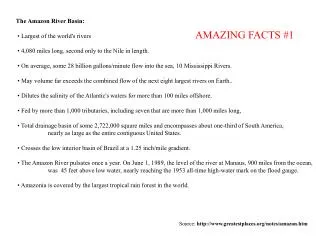
Final Considerations • The results obtained in this study will contribute to better monitoring and understanding the water cycle and in particular the improvements that can be expected when data from the current satellite missions are used. • GRACE models provide, in general, good results in Amazon Basin, due to the great of continental water variation. • In the sedimentary areas of Amazon Basin GRACE have a better response mainly in the biggest rivers like Amazonas, Solimões, Tapajós, Xingú and Madeira. • High correlation between GRACE Vdef with in-situ (GNSS) Time Series. The lowest value estimated was 0.82 in ALTA. • The longest drought period occurs in CUIB with 150 days. • In the center of basin the lag time is about 10 to 20 days and in the neighbor basins it is 30 to 45 days. • High precision leveling in the Amazon region?
Suggestions GNSS stations with purpose to support geodynamics studies in the region; Stable marks; Permanent communications links for the daily data transfer.
Thank you very much for your attention Balance “water for livelihoods” and “water as a resource”