Download
1 / 9
100 likes | 255 Views
Learn how to estimate population parameters and construct confidence intervals in statistical inference, whether for binomial or normal distributions, to make reliable data-driven decisions.

E N D
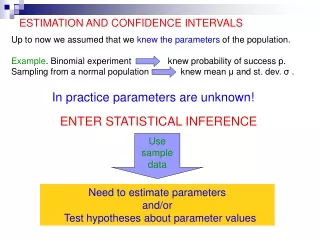
ESTIMATION AND CONFIDENCE INTERVALS Up to now we assumed that we knew the parameters of the population. Example. Binomial experiment knew probability of success p. Sampling from a normal population knew mean μ and st. dev. σ . In practice parameters are unknown! ENTER STATISTICAL INFERENCE Use sample data Need to estimate parameters and/or Test hypotheses about parameter values
POINT ESTIMATES We will estimate p for the binomial experiment, μ and σ for the normal population using single values – point estimates. NOTATION: We use a “hat” on top of a parameter to indicate an estimate: is an estimate for p, is an estimate of μ, is an estimate of σ2. Binomial experiment, X = number of successes, n=number of trials, p=probability of success is unknown. Take Then, is an unbiased estimator of p.
Point estimators for the normal parameters Let sample from N(μ, σ), μ, σ are unknown. We need to estimate both μ, and σ. Point estimator of μ: Point estimator of variance σ2: Both estimators are very good. They are unbiased and have the smallest spread among all unbiased estimators. They are called best (unbiased and minimum variance) point estimators of the corresponding parameters.
CONFIDENCE INTERVAL FOR MEAN WITH KNOWN σ. Often we seek a range of values – an interval – for the unknown parameter. We want to have some confidence that the interval covers the parameter – CONFIDENCE INTERVAL (CI) We construct CIs based on sample data and theoretical knowledge about distributions, like the Central Limit Theorem.
DERIVATION OF THE 95% CONFIDENCE INTERVAL FOR THE MEAN, NORMAL POPULATION Let sample from N(μ, σ), μ unknown, σ known. By Fact 2: has the standard normal distribution. Also, P(-1.96 ≤ Z ≤ 1.96) = 0.95. So Rearranging, In other words, the interval covers/contains μ with 95% chance. The interval ( -1.96σ√n, +1.96σ√n) is called the 95% Confidence Interval for the mean.
- zα/2 zα/2 A GENERAL C=(1-α) CONFIDENCE INTERVAL FOR THE MEAN, NORMAL DATA, σ KNOWN. What if we want to have a confidence level different from 95%? We need to choose a different z-value. Let confidence level C=1-α, the corresponding z-value is called zα/2. N(0, 1) Curve C=1-α α/2=(1-C)/2 α/2=(1-C)/2 0 A C=(1-α) confidence interval for μ is given by If the data is from a normal population with σ known.
EXAMPLES OF zα/2. • Take confidence level C=95%. Find zα/2. C=0.95, so α=0.05 α/2=0.025. From Z-table z0.025=1.96. • Take confidence level 99%. Find zα/2. C=0.99, so α=0.01 α/2=0.005. From Z-table z0.005=2.575. 0.95 0.99 0.005 0.005 0.025 0.025 1.96 1.96 2.575 2.575
Example Suppose X, scores on a test, have a normal distribution with unknown mean and σ = 60. The sample values X1, X2, …, X900 give sample mean Find a 95% as well as 98% confidence intervals for the true mean test score. Solution. Point estimate of μ is n=900, σ = 60. For 95% CI, zα/2=1.96, so 95% CI is: =(272 - 1.96(60/√900, 272 + 1.96(60/√900) = ( 268.08, 275.92). For 98% CI, zα/2=2.33, so 98% CI is: =(272 – 2.33(60/√900, 272 + 2.33(60/√900) = ( 267.35, 276.65). Note that the 98% CI is longer than the 95% CI. We gained confidence, but we lost accuracy.
What if the population is not normal? If the population is not normal, but the sample size is large, then by the Central Limit Theorem has a standard normal distribution no matter what the population is. So, provided that the sample size is large, we can use the same confidence intervals for data sets from any population. This is one of many practical applications of the CLT!