Download
1 / 15
150 likes | 180 Views
Explore 3 key methods for forecasting long-range winter weather patterns and the factors to consider in making accurate seasonal climate predictions.

E N D
Medium and Long Range Winter Forecasting “From my reading of seasonal forecasts from different meteorologists and hobbyists, there seems to be 3 methods of forecasting seasonal weather. Number 1: Persistence and Extrapolation Persistence and extrapolation means identifying what the weather pattern has been for the past 30 days, 60 days, 90 days, etc., and making assumptions about how this persistent weather pattern will evolve over the course of several months, taking into account normal seasonal changes and other factors of what would either cause this pattern to persist or change.
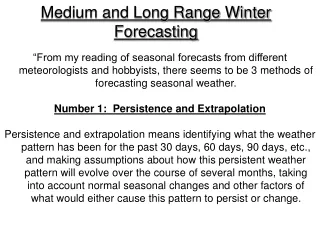
Medium and Long Range Winter Forecasting Number 2: Seasonal Indices Method The Seasonal Indices method is determining what mode/phase the prominent ocean, pressure, solar, etc. indices are in at the current time and then predicting what they will be for the next several months. Then drawing conclusions on the physical impacts these indices will have on the weather pattern and/or picking certain past years that have exhibited similar values or patterns to those indices (analogs) and formulating a seasonal forecast Number 3: Past Foretells the Future The third method involves identifying what the weather has done over the past several months or some other arbitrary length of time, and then identifying years that have behaved similarly and seeing if similar signals existed in those winters, and then applying those findings to a winter forecast that exhibited similar antecedent conditions. This method is usually a more regional or local seasonal forecast.
Medium and Long Range Winter Forecasting All of these methods have flaws, and no one approach is always successful. But at the moment, it seems to be the state of the seasonal weather forecasting business. My own opinion is that a combination of all three is the way to go.” (RaleighWx)
Medium and Long Range Winter Forecasting “A caveat when issuing a seasonal forecast: Long range seasonal forecasting is still in its infancy. Although great strides have been made, there is still considerable uncertainty and the potential for significant errors in these outlooks. Meteorologists believe they can provide more value and accuracy than a mere coin flip, but the ideas presented should be viewed as general guidance and themes. The more specific they get, the more chance there is to err. This is especially true for snow amounts, as 1 or 2 storms or lack thereof can make or break snowfall totals.” (Capital Weather)
When Making a Winter Forecast Consider… Forecast of Seasonal Climate Anomalies CPC Data Climate Links from CPC Note: Factors to consider are ranked either 3 (heavy weight), 2 (middle weight), or 1 (light weight) relative to how large a role each factor should play into your medium and long range forecast. Note: Avoid month by month forecasting if at all possible. Use time frames that include parts of two months or just part of a single month. • State of the Atmosphere (trends etc.) MR = 1 LR = 2 • Local climatology (averages and extremes) MR = 1 LR = 2 • Analog years with respect to one factor or a whole ensemble of factors MR = LR = Climate Indices: Monthly Atmospheric and Ocean Time Series Climate Data Archive
When Making a Winter Forecast Consider… • State of the NAO (Prior to and forecasted state during the winter) • Snow cover in Canada • October Temperatures and Precipitation relative to normal. • November temperatures and precipitation relative to normal • PDO/PNA • Hurricane season prior to the winter season • ENSO (El Nino, Neutral, or La Nina). Also note whether weak, moderate, or strong.
When Making a Winter Forecast Consider… • Ocean temperatures • Late summer/fall climate patterns (i.e. storm tracks, storm intensity, upper level winds, air mass origin and movement, and character/position of large scale pressure systems) • “Pay great attention to patterns within the last year, season to season, month to month, and week to week.” (Rob Guarino)
When Making a Winter Forecast Consider… • Polar vortex location and forecasted positions. • MEI • QBO • EPO • SOI • Variables that are impossible to forecast: factors that can make or break a forecast • TIMING, TIMING, TIMING! • Precipitation type changeover during a storm (i.e. snow to ice, snow to rain, rain to snow etc.) • Single event impact on a seasonal forecast
What Can Go Wrong? (Capital Weather 2006-2007 Winter Forecast) • Caveats -- What Can Go Wrong With Our Forecast?: • The NAO is very positive for much of the winter. This doesn't automatically mean a warm winter. But with a cooler pool of water currently in the Gulf of Alaska among other factors, the chances of a warm east coast would be significantly higher. This would also lead to many events being rain or snow to freezing rain/rain, thus less snow. Chances: 25% • We never see a real pattern change/positive NAO emerge as we head through November, and December ends up much colder than forecast. Chances: 25% • The El Nino becomes stronger than predicted. If this happens the chances greatly increase for the warmer air that is typically found in the Plains and northwest during Enso events to penetrate further east. Our winter would likely be much warmer and less snowy than forecast. Chances: 15% • The El Nino weakens much more quickly than forecast. If this happens, the effects are less clear. But chances of a warmer and less stormy winter would increase. This could also signal an earlier end to winter. Chances: 10%
Long Range Snow Forecasts (Glenn “Hurricane” Schwartz One of the comments I’ve heard concerns the large range in the snow forecasts amounts. The 25-35” was thought by some to be wide a range. Frankly, if I thought I had the ability to be more specific, I would. Forecasting a range that is well above normal snowfall (like this year) should be acceptable. Predicting 15-25” would not, since it straddles normal. Using a 5- inch range would be more appropriate, so it wouldn’t look I’m covering all possibilities. And predicting a specific amount, even to the tenth of an inch, let alone predict it months in advance. That is a classic misuse of science and statistics. And speaking of science and statistics, I was seriously considering leaving out the part of the monthly temperature forecasts which frankly hasn’t shown enough skill to satisfy me over the years. The pattern looked a bit clearer this time, so I’m giving it another shot. But if it doesn’t work out, I may eliminate it until measurable skill is seen in the future. I f there is no skill in a certain type of forecast, it won’t be attempted. Other blogs this week will go into more detail on the specific reasons for the forecast, and I’ll share some comments from viewers on the forecast itself. Glenn Schwartz Chief Meteorologist, NBC10 1/21/06
Philadelphia Climatology The ten snowiest years (July through June) from July, 1884 to present at Philadelphia: 1. 65.5; 1995-6 2. 55.4; 1898-9 3. 54.9; 1977-8 (Moderate El Nino) 4. 49.1; 1960-1 5. 46.3; 2002-3* (Moderate El Nino) 6. 44.3; 1966-7 7. 43.9; 1917-8 8. 43.8; 1904-5 9. 41.8; 1957-8 (Moderate El Nino) 10. 40.2; 1978-9 NOTE: 85% of our big snowstorms have occurred after January 19th. (Glenn “Hurricane” Schwartz)
Climatology: Correlation Between December and January Temperatures (NWS - Mt. Holly) So far this month the departure from normal in Philadelphia has been -1.2F. The relevance of what occurs in December with respect to January temperatures has been shown by Meteorologist Joe D’ Aleo (Among Others) as one of the stronger month to month correlations of the calendar year. Similar results have occurred in Philadelphia. In the 134 year climatological history for Philadelphia we divided December into thirds (Colder than normal/ about normal/ warmer than normal). We then matched the ensuing January temps in the same categories. Since temperatures have a near normal statistical distribution, if there was no correlation involved each category would have about thirty-three percent of all cases. This is obviously not the case below. We also did a subset for Decembers in which an El Nino was in progress.
Climatology: Correlation Between December and January Temperatures By the way, the two exceptions to the rule in warmer than normal ENSO Decembers occurred in 1987 and 1911. Coincidence of not, both were moderate ENSO Decembers and the current weekly departure in the NINO 3.4 region is in the moderate ENSO range. January 1912’s mean temperature was 14.9F colder than December 1911.
Interrelationships of Snowfall Climatology Data (seasonal snowfall climatology when Philadelphia has reported < 0.1 inch of snow as of January 15)