Download
1 / 16
160 likes | 253 Views
Explore innovative methods, including Dr. Perrizo’s Total Variation Theory, for optimizing K-Means clustering. Discover two killer ideas for refining cluster detection, their results, and implications for outlier detection. Conclude with insights on performance and potential enhancements.

E N D
Determining the ‘k’ in k-Means Clustering Jacob Halvorson
Overview • K-Means overview • Dr. Perrizo’s Total Variation Theory • Killer Idea #1 • Results • Killer Idea #2 • Results • Conclusion
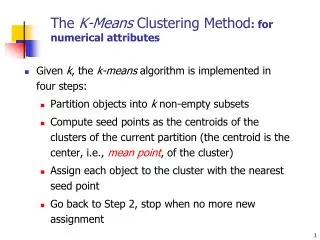
K-Means Overview • Place K points into the space represented by the objects that are being clustered. These points represent initial group centroids. • Assign each object to the group that has the closest centroid. • When all objects have been assigned, recalculate the positions of the K centroids • Repeat Steps 2 and 3 until the centroids no longer move. This produces a separation of the objects into groups from which the metric to be minimized can be calculated.
Dr. Perrizo’s Total Variation Theory • Start at a point in the dataset. • Expand around that point until the density drops off. • Add that cluster center to a list of possible clusters and remove all points in the radius from the original list. • Repeat until no more points left and choosing a new cluster center that is far from the previous one. • Total Variation, Radius, and Density are factors.
Killer Idea #1 • Pick any random point in the dataset as the cluster center • Expand the radius some value • Minimum distance between all points • Determine density • If (new density)/(old density) > high density threshold • We have run into another cluster. Throw out data • If (new density)/(old density) < low density threshold • We have a cluster or an outlier. Add cluster to list • Remove cluster from original list • Else • expand again • Repeat
Killer Idea #2 • Similar to Killer Idea #1, except we want to run into another cluster. That is our stopping condition. • If [(current ring density) > (previous ring density) && (new density) > (old density)] • Add cluster to list. • Remove the cluster from original list • Repeat • Outlier trouble?
Conclusion • Both Killer Ideas are very sensitive. • The results can be somewhat different due to the random nature of the program. • Killer Idea #2 found extra potential clusters that I hadn’t even thought of. • What about outliers? • More work needs to be done.
References • “K-Means Clustering” http://www.elet.polimi.it/upload/matteucc/Clustering/tutorial_html/kmeans.html. 28 Nov. 2004 • IRIS data ftp://ftp.ics.uci.edu/pub/machine-learning-databases/iris/. 21 Nov. 2004 • Dr. Perrizo’s lecture notes.