Clustering Techniques K-Means & EM
Clustering Techniques K-Means & EM. Mario Haddad. What is Clustering?. Cluster: a collection of data objects Similar to one another within the same cluster Dissimilar to the objects in other clusters Clustering is unsupervised classification : no predefined classes Typical applications

Clustering Techniques K-Means & EM
E N D
Presentation Transcript
Clustering TechniquesK-Means & EM Mario Haddad
What is Clustering? • Cluster: a collection of data objects • Similar to one another within the same cluster • Dissimilar to the objects in other clusters • Clustering is unsupervised classification: • no predefined classes • Typical applications • As a stand-alone tool to get insight into data distribution • As a preprocessing step for other algorithms
K-Means • Groups data into K clusters and attempts to group data points to minimize the sum of squares distance to their central mean. • Algorithm works by iterating between two stages until the data points converge.
Problem Formulation Given a data set of {x1,…,xN} which consists of N random instances of a random D-dimensional Euclidean variable x. Introduce a set of K prototype vectors, µk where k=1,…,K and µk corresponds to the mean of the kth cluster.
Problem Formulation • Goal is to find a grouping of data points and prototype vectors that minimizes the sum of squares distance of each data point.
Problem Formulation (cont.) • This can be formalized by introducing an indicator variable for each data point: • rnk is {0,1}, and k=1,…,K • Our objective function becomes:
How K-Means works Algorithm initializes the K prototype vectors to K distinct random data points. Cycles between two stages until convergence is reached. Convergence: since there are only a finite set of possible assignments.
How K-Means works • 1. For each data point, determine rnk where: • 2. Update µk :
How K-Means works (cont) If k (number of clusters) and d (dimension of variables) are fixed, the clustering can be performed in time. Exponential bounds for plane:
K-Means Initialization example • Pick K cluster centers(unfortunate choice)
K-Means Initialization example • Pick K cluster centers (random choice)
K-Means++K-Means with smart initial seeding • Choose one center uniformly at random from among the data points. • For each data point x, compute D(x), the distance between x and the nearest center that has already been chosen. • Choose one new data point at random as a new center, using a weighted probability distribution where a point x is chosen with probability proportional to D(x)2. • Repeat Steps 2 and 3 until k centers have been chosen. • Now that the initial centers have been chosen, proceed using standard k-means.
K-Means++ • This seeding method yields considerable improvement in the final error of k-means • Takes more time to initialize • Once initialized, K-Means converges quickly • Usually faster than K-Means • 1000 times less prone to error than K-Means
K-Means Example • Cluster black and white intensities: • Intensities: 1 3 8 11 • Centers c1 = 7, c2=10 • Assign 1, 3, 8 to c1, 11 to c2 • Update c1 = (1+3+8)/3 = 4, c2 = 11 • Assign 1,3 to c1 and 8 and 11 to c2 • Update c1 = 2, c2 = 9 ½ • Converged
K-Means Image Clusters on intensity Computer Vision - A Modern Approach Set: Segmentation Slides by D.A. Forsyth
K-Means Original: After Intensity Clustering:
K-means using color alone, 11 segments. Computer Vision - A Modern Approach Set: Segmentation Slides by D.A. Forsyth
K-means using color and position,20 segments. Computer Vision - A Modern Approach Set: Segmentation Slides by D.A. Forsyth
Pros and Cons of K-Means Convergence: J may converge to a local minima and not the global minimum. May have to repeat algorithm multiple times. With a large data set, the Euclidian distance calculations can be slow. K is an input parameter. If K is inappropriately chosen it may yield poor results.
Local Minima • K-Means might not find the best possible assignments and centers. • Consider points 0, 20, 32. • K-means can converge to centers at 10, 32. • Or to centers at 0, 26. • Heuristic solutions • Start with many random starting points and pick the best solution.
EM Expectation Maximization
Soft Clustering • Clustering typically assumes that each instance is given a “hard” assignment to exactly one cluster. • Does not allow uncertainty in class membership or for an instance to belong to more than one cluster. • Soft clustering gives probabilities that an instance belongs to each of a set of clusters. • Each instance is assigned a probability distribution across a set of discovered categories (probabilities of all categories must sum to 1).
EM • Tends to work better than K-Means. • Soft Assignments • A point is partially assigned to all clusters. • Use probabilistic formulation
Mixture of Gaussians • g(x; m, σ) • The probability of a point x based on a Gaussian Distribution with mean m and variance σ
A mixture of K Gaussians • A distribution generated by randomly selecting one of K Gaussians, then randomly draw a point from that distribution. • Gaussian k with a probability of pk • Goal: find pk, σk,mk that maximize the probability of our data points.
Back to EM • Iterative Algorithm • Goal: group some primitives together • Chicken and Egg problem: • Items in group -=> Description of the group • Description Of the group -=> Items in group
EM • Iterative Algorithm: E Step and M Step • E Step: • Compute the probability that point n is generated by distribution k
EM • M Step:
EM • Converges to a locally optimal solution • Each step increases the probability of the points given the distributions. • Can get stuck in local optima (less than K-Means)
EM vs K-Means local optima • 1D points at 0 20 32 • Centers at 10 and 32 • A local minima for k-means • EM: 20 almost evenly shared between the two centers. • The center at 32 moves closer to 20 and takes over • First center shifts to the left.
EM and K-means • Notice the similarity between EM for Normal mixtures and K-means. • The expectation step is the assignment. • The maximization step is the update of centres. • K-means is a simplified EM. • K-means makes a hard decision while EM makes a soft decision when updating the parameters of the model.
EM and K-Means K-Means EM
EM and K-Means K-Means EM
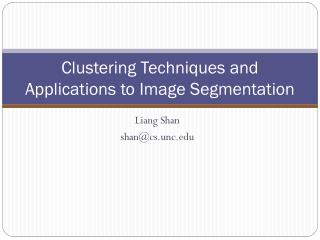
Fast Image Segmentation Based on K-Means Clustering with Histograms in HSV Color Space
Motivation • Gray and color histograms in HSV color space for K-Means clustering • Cluster number automatically set by “Maximin” initialization • Fast and efficient to extract regions with different colors in images. • Segmentation results are close to human perceptions.
Maximin Initialization and Parameter Estimation • Use Maximin to initialize number of clusters and centroid positions: • Step A: From the color histogram bins and gray histogram bins, find the bin which has the maximum number of pixels to be the first centroid.
Maximin Initialization and Parameter Estimation • Step B: For each remaining histogram bin, calculate the min distance, which is the distance between it and its nearest centroid. Then the bin which has the maximum value of min distance is chosen as the next centroid. • Step C: Repeat the process until the number of centroid equals to KMax or the maximum value of the distance in Step B is smaller than a predefined threshold ThM.
Maximin Initialization and Parameter Estimation • Kmax is set to 10. • There should be no more than 10 dominant colors in one image for high level image segmentation. • ThM is set to 25. • According to human perception of different colors in HSV color space.
K-Means Clustering in HSV Color Space • Step 1: Estimate the parameters of K-Means. • Step 2: Two kinds of histogram bins will be clustered together in this step. For color histogram bins, since the hue dimension is circular (e.g. 0◦ = 360◦), the numerical boundary should be considered in the distance measurement and the process of centroid calculations.
K-Means Clustering in HSV Color Space • For gray histogram bins, there is no hue information inside. which means that the saturation values of gray histogram bins are all considered as zero, and the hue values can be arbitrary.
K-Means Clustering in HSV Color Space • Step 3: Recalculate and update K cluster centroids. Again, since the hue dimension is circular, the indices in the hue dimension should be considered not absolutely but relatively.
K-Means Clustering in HSV Color Space • Step 4: Check if the clustering process is converged according to the total distortion measurement, which is the summation of distances between each histogram bin and its nearest cluster centroid • When the difference of total distortion measurement is smaller than a predefined threshold or max iterations reached, terminate. Else, go to step 2
K-Means Clustering in HSV Color Space • Step 4 intuition: • G(v) represents the number of pixels in the gray histogram bin with parameter v • B(h, s, v) represents the number of pixel in the color histogram bin with parameters (h, s, v)