Download
1 / 9
90 likes | 164 Views
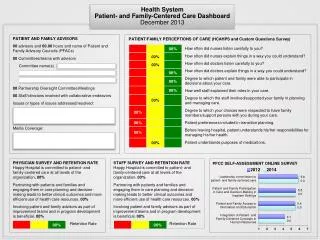
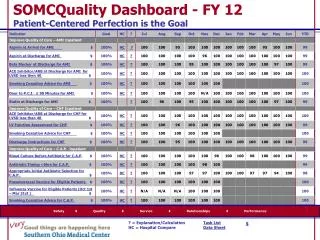
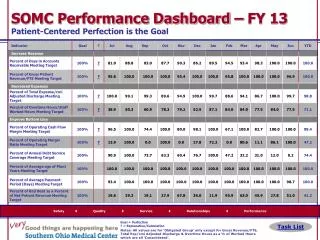
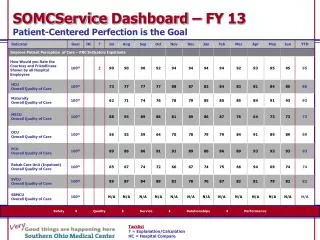
Explore FY 13 data on Safety, Quality, Service, Relationships, and Performance in the healthcare sector through the SOMC Service Dashboard. Utilize task lists for explanation and calculation. Compare hospital data for improvement.

E N D
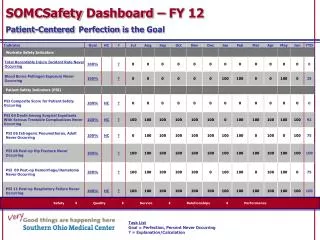
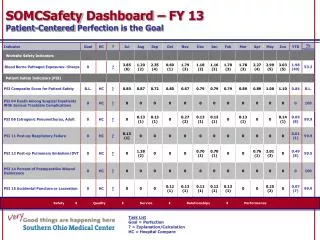
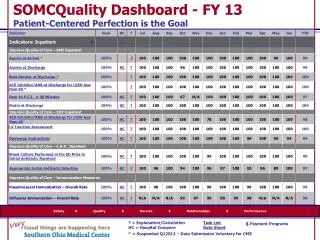
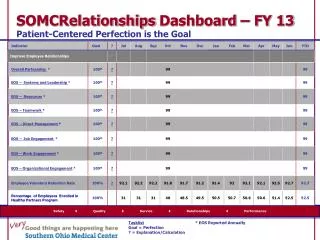
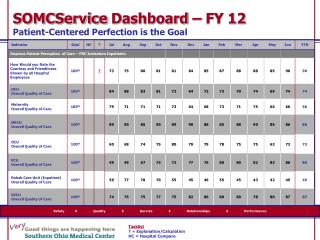
SOMCService Dashboard – FY 13Patient-Centered Perfection is the Goal Safety Quality Service Relationships Performance Tasklist ? = Explanation/Calculation HC = Hospital Compare
SOMCService Dashboard – FY 13Patient-Centered Perfection is the Goal Safety Quality Service Relationships Performance $ Tasklist ? = Explanation/Calculation HC = Hospital Compare
SOMCService Dashboard – FY 13Patient-Centered Perfection is the Goal Safety Quality Service Relationships Performance $ Tasklist ? = Explanation/Calculation HC = Hospital Compare
SOMCService Dashboard – FY 13Patient-Centered Perfection is the Goal Safety Quality Service Relationships Performance $ Tasklist ? = Explanation/Calculation HC = Hospital Compare
SOMCService Dashboard – FY 13Patient-Centered Perfection is the Goal Safety Quality Service Relationships Performance Tasklist ? = Explanation/Calculation HC = Hospital Compare
SOMCService Dashboard – FY 13Patient-Centered Perfection is the Goal Safety Quality Service Relationships Performance Tasklist ? = Explanation/Calculation HC = Hospital Compare
SOMCService Dashboard – FY 13Patient-Centered Perfection is the Goal Safety Quality Service Relationships Performance Tasklist ? = Explanation/Calculation HC = Hospital Compare
SOMCService Dashboard – FY 13Patient-Centered Perfection is the Goal Safety Quality Service Relationships Performance Tasklist ? = Explanation/Calculation HC = Hospital Compare
Whatquestionsdo you have? www.somc.org S a f e t yQ u a l i t yS e r v i c e R e l a t i o n s h i p sP e r f o r m a n c e