Download
1 / 12
120 likes | 225 Views
Remote Sensing and Modeling of the Georgia 2007 Fires. Eun-Su Yang, Sundar A. Christopher, Yuling Wu, Arastoo P. Biazar Earth System Science Center University of Alabama in Huntsville Shobha Kondragunta NOAA/NESDIS. Presentation to 2008 CMAS Conference October 7, 2008. Outline.

E N D
Remote Sensing and Modeling of the Georgia 2007 Fires Eun-Su Yang, Sundar A. Christopher, Yuling Wu, Arastoo P. Biazar Earth System Science Center University of Alabama in Huntsville Shobha Kondragunta NOAA/NESDIS Presentation to 2008 CMAS Conference October 7, 2008
Outline • Overview of the GA/FL fires in May 2007 • Fire emissions derived from satellite data • Air quality modeling approach • CMAQ simulations with local emissions • Simulations with local plus fire emissions • Evaluations with satellite and in-situ data • Summary
Meteorological situation in May 2007 MM5: Surface pressure and wind NCEP 850 hPa Geopotential Height: http://www.cdc.noaa.gov/cdc/reanalysis Dry spring caused extensive wildfires in Georgia and Florida.
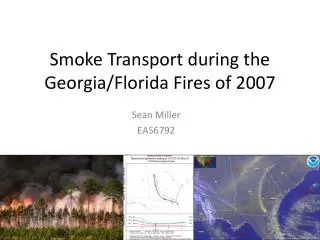
Fires in May 22, 2007 MODIS Terra: 1615Z FLAMBE (upper) http://www.nrlmry.navy.mil/flambe/index.html (left) http://rapidfire.sci.gsfc.nasa.gov/realtime/2007142 Fire detection is near real time.
Biomass Burning Emissions Emissions (kg) = (burned area) GOES x (fuel load) MODIS vegetation x (fraction of combustion) AVHRR moisture x (fraction of emission) AVHRR moisture Produces: PM2.5*, CO, N2O, NH3, SO2, CH4, NOX*, and TNMHC*. (*non-CBIV species) Biomass burning emissions are derived from (burned area).
Contribution of local emission smoke plume or local emission? PM2.5 mass from one location in Birmingham, Alabama from April 1-May 31, 2007. The colors indicate various air quality categories ranging from Good to extremely unhealthy conditions. Background emissions could be important in urban areas.
MM5/SMOKE/CMAQ Biogenic (BEIS3) Mobile (MOBILE6) Point, Area MM5/WRF SMOKE:Emission Inventory Model validation satellite and ground-based measurements: AOT, PM2.5 CMAQ input fire emissions Good Moderate Unhealthy for Sensitive Group Unhealthy Very Unhealthy Hazardous AQI Forecast:
Modeling Approaches • CMAQ run for May 22-23. • 12-km grid. • 40 vertical layers: more layers near surface and tropopause. • Include BIOGENIC and MOBILE emissions for local emissions. • EBI solver, cb4-ae4-aq mechanism. • Fire emissions are uniformly distributed from surface to PBL.
AOT simulations with local & fire emissions There is big difference near the boundary of smoke plume.
PM2.5 simulations with local & fire emissions Local emissions are ok, but fire emissions are overestimated.
Summary • Fire emissions can be estimated near-real time satellite measurements. • Meteorological fields such as winds are important to precisely locate fire plumes. • The results are preliminary and, therefore, subject to change. • Fire emission rate are overestimated; need check consistency in unit.