Download
1 / 1
10 likes | 231 Views
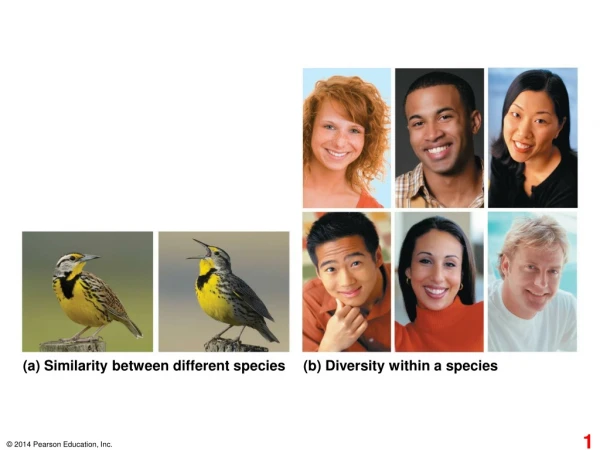
O. brachyantha. O. nivara. O. rufipogon. O. glaberrima. O. punctata. O. officinalis. FF. AA. BB. CC. Comparative Genomic Analysis of a Region Including Calmodulin Gene in Four Oryza Species.

E N D
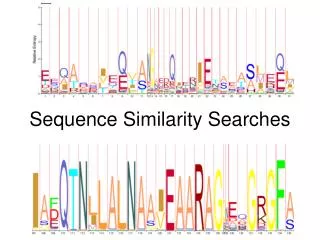
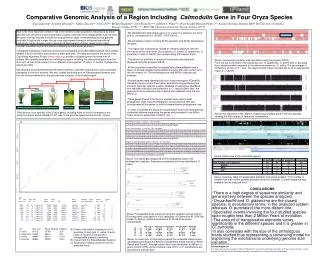
O. brachyantha O. nivara O. rufipogon O. glaberrima O. punctata O. officinalis FF AA BB CC Comparative Genomic Analysis of a Region Including Calmodulin Gene in Four Oryza Species Tun Liang Ong*, Aswathy Sebastian**, Andrea Zuccolo**, Yeisoo Yu**, Michele Braidotti**, Steve Rounsley*** and Rod A. Wing*** iPlant Teacher Research Fellow, ** Arizona Genomics Institute, BIO5 The University of Arizona, Tucson, Arizona, 85721 ***, BIO5 The University of Arizona, Tucson, Arizona, 85721 -We identified the calmoduline gene in O. sativa: it is placed in the short arm of chromosome 3 (11573337-11575136 nt).-We extracted a region including 50 Kb upstream and 50 Kb downstream the gene.-The region was compared by means of similarity searches, with the short arms of the other three Oryza species (O. barthii, O. glaberrima, O. punctata) in order to identify the corresponding orthologous tracts.-The amount of similarity in reciprocal tracts was calculated and displayed using the program VISTA.-All the tracts were searched for repeats using RepeatMasker and a library of already isolated transposable elements. We also carried out a de novo search of LTR-retrotransposons and MITEs using dot plot analyses.-Putative genes were identified de novo using the program FGeneSH trained for monocots and then further annotated using evidence from similarity searches against a public database of sequences (GenBank, non redundant division) and collections of O. sativa flcDNA. Also, the genome structure was manually checked and validated using the tool APOLLO.-Three genes shared in all the four species were used to build phylogenetic trees using the Neighbour-Joining method. We also concatenated all the genes to build a comprehensive phylogenetic tree.-In order to estimate the timing of the speciation events we estimated the nucleotide distance separating the genes and translated it into Million Years using an appropriate mutation rate. Rice is the most important cereal to half of the world's human population. Because of its small genome size, the pronounced conservation of gene order with other related plants and the short life cycle, rice has become a model for crop genomics study. Understanding the rice genome may help to fight world hunger through crop improvement aimed at enhanced agricultural productivity, better disease control, and spinoff improvement of other cereal crops. It also provides valuable insights into botanical diversity and molecular evolution. Comparative analyses of genome structure and sequence of closely related species have yielded insights into the evolution and function of plant genomes. The data produced in the frame of the Oryza Map Alignment Project (www.omap.org) provide a suitable system for these kind of studies. We carefully annotated an orthologous region including the calmoduline gene from the short arm of the chromosome 3 in four different Oryza species: O.sativa, O. barthii, O.glaberrima, and O.punctata. We identified and characterized all the genes and then used their sequences to infer a possible phylogeny for the four species. We also studied the distribution of Transposable Elements and the role of these elements to the genome size variation of the studiedregion. Above: Interspecies similarity was calculated using the program VISTA. From the top to the bottom the sequences are: O. glaberrima, O. barthii and O. punctata. Each sequence was compared to the reference sequence, O. sativa. The percentage of similarity is shown on Y – axis. The region boxed in blue corresponds to an un-sequenced region in O .barthii. Above: the alignment of the Alpha-L-arabinofuranosidase gene in the four species showing the high degree of sequence conservation. A) >Calmodulin Gene,O.sativa, 149 residues MADQLTDDQIAEFKEAFSLFDKDGDGCITTKELGTVMRSLGQNPTEAELQDMINEVDADGNGTIDFPEFLNLMARKMKDTDSEEELKEAFRVFDKDQNGFISAAELRHVMTNLGEKLTDEEVDEMIREADVDGDGQINYEEFVKVMMAK >PIK-like protein, O.sativa, 509 residues MYRAKRAALSPKVKRRVGKYELGRTIGEGTFAKVRFAKNTENDEPVAIKILDKEKVQKHRLVEQIRREICTMKLVKHPNVVRLFEVMGSKARIFIVLEYVTGGELFEIIATNGRLKEEEARKYFQQLINAVDYCHSRGVYHRDLKLENLLLDASGNLKVSDFGLSALTEQVKADGLLHTTCGTPNYVAPEVIEDRGYDGAAADIWSCGVILYVLLAGFLPFEDDNIIALYKKISEAQFTCPSWFSTGAKKLITRILDPNPTTRITISQILEDPWFKKGYKPPVFDEKYETSFDDVDAAFGDSEDRHVKEETEDQPTSMNAFELISLNQALNLDNLFEAKKEYKRETRFTSQCPPKEIITKIEEAAKPLGFDIQKKNYKMRMENLKAGRKGNLNVATEVFQVAPSLHVVELKKAKGDTLEFQKVPFFDTGNFAISNLLFTAKFNQNQFCCETTVLQNPVDPAQGRGLEVRRRGRRQRRRGVNVVFAMAFGAPVLRVHSCSAIINGVFAVE >Alpha-L-arbinofuranosidase,O.sativa, 673 residues MGVRRGRLDSSLFHMLVLVCALSQVLFVGLVTGQTAQLSVDASSQNGRTIPDKMFGIFFEELNHAGAGGLWAELVSNRVQVTGFEAGGINTPSNIDPWLIIGDESNIIVETDRSSCFASNPIALRMEVLCGATGTNACPSGGVGIYNPGYWGMNIEKTKVYKVSMYIRSSDSVDLAVSLTSSDGLQNLATHTITAEKGDFAGWTKVEFDLQSSERNTSSRLQLTTTKNGIIWFDQVSVMPSDTYMGHGFRKDLATMLANLKPRFLKFPGGNYVMGNYLLNAFRWSETIGPWEERPGHFNDVWNYWTDDGLGFFEFLQLAEDLDACPVWVINDGASLNEQIPSATIAAFVKDVVDGIEFARGDPKTTWGSVRAAMGHPEPFPLYYISVGNQECSKPYYKEKYVKFYSAIKASYPDIKIISSCDISSISAVNPADLYDVHEYLRWTLTLSLWQVYTSSGDMFSKTRMFDSTPRSGPKAFVSEYAVTGNDAGRGTLVAALAEAAFLIGLERNRFSPDAIVFNSWQHYGCPNYWMLHFFKDSSGATLHPLTIQVSNYDQLAASALTWQNSNDGNTYLKIKVVNFGNKAVNLNIAVAGLENGIQEFGSIKTVLTSGWLRDENSFQQPDKVVPAASPITNAGEKMGVIVDPYSLTSFDLLLDTNTDKYPLLESSFHSSM O. brachyantha O. sativa O. rufipogon O. glaberrima O. punctata O. officinalis The pictures of six species of the Oryza genus including three of the four analyzed in this study are shown above. AA,BB,CC,FF refer to the genome types that are found in Oryza Above: Apollo view of the annotated regions. Above. The amino acid sequence of the three genes used in the phylogenetic analyses. Sequences presented are those identified in O. sativa. Glaberrima Barthii Punctata Above. Summary table of transposable elements and genes isolated. *This number is smaller than that of other species because not all the complete O. barthii sequence was available for the analyzed tract. Glaberrima Barthii Punctata CONCLUSIONS • There is a high degree of sequence similarity and gene synteny between the species analyzed. • Oryza barthii and O. glaberrima are the closest species, in evolutionary terms, in the analyzed system whereas O. punctata is the more distant one. • Speciation events involving the four studied species span roughly less than 2 Million Years of evolution. • The amount of transposable elements varies significantly in the different species and it is greater in O. punctata. • It also correlates with the size of the orthologous tracts studied thus representing a convincing model for explaining the mechanisms underlying genome size variation. Glaberrima Barthii Punctata B) Glaberrima Barthii Above. Phylogenetic trees were built using the neighbor-joining method. Bootstrap were calculated for 1000 replicates. A) Calmodulin B) CIPK-like protein C) Alpha-L-arabinofuranosidase D) All the three genes concatenated. A) C) A) Detail of the dotplot comparison for O. punctata (X-axis) and O. sativa (Y-axis): tracts not shared correspond to transposable elements insertions B) Output from the RepeatMasker Analysis C) Summary of repeat content in the four analyzed tracts B) Above. For each pair of orthologous genes the nucleotide distance was calculated according to the Kimura 2 parameters model (columns Gene1, Gene2 and Gene3). Average values were then translated into Million of years (column MYA) using a mutation rate of 6.5 x 10⁻⁹ substitutions per synonymous site per year. Acknowledgement T. L.Ong expresses his gratitude to IPlant Collaborative and Arizona Genomics Institute, the University of Arizona, for the Summer Teacher Research Fellowship. Funding is provided by the National Science Foundation. C) D)