Download
1 / 56
640 likes | 1.05k Views
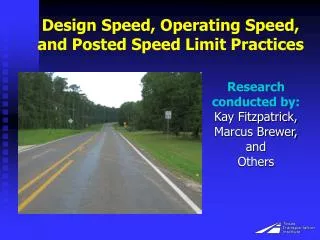
Design Speed, Operating Speed, and Posted Speed Limit Practices. Research conducted by: Kay Fitzpatrick, Marcus Brewer, and Others. “Famous” Quote. “Finally I passed a road sign that read, WELCOME TO TEXAS – DRIVE FRIENDLY.”

E N D
Design Speed, Operating Speed, and Posted Speed Limit Practices Research conducted by: Kay Fitzpatrick, Marcus Brewer, and Others
“Famous” Quote “Finally I passed a road sign that read, WELCOME TO TEXAS – DRIVE FRIENDLY.” “Was it my imagination, or did everyone on the road suddenly start driving faster?” - Joan Bauer, Rules of the Road
Today’s Presentation • Material primarily from NCHRP projects • Design speed – definition and selection • Influences on operating speed • Setting of posted speed limits • Development of criteria for higher design speeds
What is the Relationship? Operating Speed Design Speed Posted Speed
Relationships Operating Speed Posted Speed Design Speed
Relationships Operating Speed Design Speed Posted Speed
Design Speed Examples of Where Used • Stopping sight distance • Horizontal curves and superelevation • Vertical grades and curves • Ramp acceleration and deceleration lane lengths • Roadside treatments
Design SpeedDefinition • Original definition “…the maximum approximately uniform speed which probably will be adopted by the faster group of drivers but not, necessarily, by the small percentage of reckless ones.” -1938 AASHO
Design SpeedDefinition • Previous definition “…the maximum safe speed that can be maintained over a specified section of highway when conditions are so favorable that the design features of the highway govern.” -1994 Green Book, p. 62
Design SpeedDefinition • Current definition (for now…) “…a selected speed used to determine the various geometric design features of the roadway.” -2004 Green Book, p. 67 -2011 Green Book, p. 2-54
Design Speed Assumed Relationship to Running Speed Note: Has Been Eliminated for Selected Criteria Values from 2004 GB
Design SpeedRelationships • Research has found 85th percentile speeds > design speed • Large majority of drivers = reasonable and prudent • Therefore - associated risk not excessive (even when higher than design speed) for typical situations
Design Speed AASHTO Policy on Selection “Except for local streets where speed controls are frequently included intentionally, every effort should be made to use as high a design speed as practical to attain a desired degree of safety, mobility, and efficiency within the constraints of environmental quality, economics, aesthetics, and social or political impacts.” -2004 Green Book, p. 67
Design Speed AASHTO Policy on Selection “The selected design speed should be a logical one with respect to the topography, anticipated operating speed, the adjacent land use, and the functional class of the highway. In selection of design speed, every effort should be made to attain a desired combination of safety, mobility, and efficiency within the constraints of environmental quality, economics, aesthetics, and social or political impacts.” -2011 Green Book, p. 2-54
Design Speed AASHTO Policy on Selection • Functional classification • Rural versus urban • Terrain type “Some design features, such as curvature, superelevation, and sight distance, are directly related to, and vary appreciably with, design speed. Other features, such as widths of lanes and shoulders and clearances to walls and rails, are not directly related to design speed, but they do affect vehicle speeds.” -2011 Green Book, p. 2-55
Design Speed Selection United States Practices – NCHRP 504 • Mailout Survey • “What factors are considered when selecting a design speed for a new road?” • 40 states responded • Answers could be distributed over a range of approaches
Influences on Operating Speed Field Studies • 79 tangent sites, most suburban/urban • Sites not near signals or horizontal curves (elements known to influence operating speed) • Free-flow speed measured with lidar • Roadway and roadside characteristics
60 45 85th %-lie Speed (mph) 30 Local Collectors Arterial, C&G 15 Arterial, Shoulder SL = 85th 0 15 30 45 60 0 Posted Speed Limit (mph) Influences on Operating Speed Findings
100 80 60 Arterials, 69 sites 40 Collectors, 20 sites 20 Locals, 13 sites 0 0 10 20 30 40 50 60 70 Influences on Operating Speed Findings Cumulative Dist (%) 85th %-ile Speed (mph)
Influences on Operating Speed Findings 75 Local Collectors 60 Arterial, C&G Arterial, Shoulders 45 85th %-ile Speed (mph) 30 15 0 0 30 60 90 120 150 180 Access Density (pts/mi)
Influences on Operating Speed Findings Est. 85th = Intercept + Posted Speed Limit
Influences on Operating Speed Recommendations • Several variables show influences: • Access density • Pedestrian activity • Absence of centerline or edge line markings • On-street parking • Median presence • Additional data needed
Posted Speed LimitsMUTCD Guidelines • Within 5 mph of 85thpercentile speed of free-flowing traffic • Road characteristics • Speed pace • Roadside development • Parking practices • Reported crash experiences
Posted Speed Limits Results from ITE Survey • 85th percentile speed predominant factor • Roadway geometry • Roadside development • Crash experiences • Political pressure
Operating and Posted SpeedSummary of Field Study Findings • Previous findings: • 85th %-ile speed exceeds posted • 50th %-ile speed near posted • NCHRP/other studies: • Rural: 37 to 72% at posted speed • Suburban/urban: 32 to 52% at posted
Posted Speed LimitZoning Reports • ITE TENC Committee 97-12 • Request “speed zoning investigations your agency has recently conducted” • 256 reports received • 128 contained both 85th percentile speed value and speed limit recommendation
100 75 Cumulative Frequency 50 25 0 -5 0 5 10 15 20 Posted Speed LimitSpeed Zone Studies 128 speed zone studies 10% rounded up and 31% rounded to nearest5 mph Diff (85th – Recom SL)
Posted Speed LimitComments • 85th percentile speed is a “starting point” • Encourage changes in how speed limits are set?
Have: Design criteria for 75 - 80 mphObjective: Design criteria for 85 - 100 mph Design Criteria for Higher Speed Mobility Corridors: TxDOT Project 0-5544
Research Approach TxDOT Design Division • Determine • Potential Values • and • Concerns/Issues • Identify Existing Methodology • Extrapolations • Update Assumptions • Use Engineering Judgment AASHTO & Texas Policies Previous Studies Additional Investigation/ Refine Documentation Related Literature Texas Roundtable 15 TxDOT/FHWA Experts International Practices
Controlling Criteria • Stopping sight distance • Grades • Vertical alignment • Lane width • Shoulder width • Cross slope • Horizontal alignment • Superelevation
Stopping Sight Distance • NCHRP 1990s study SSD = 1.47 V t + 1.075 V2/a • Driver eye & object height • Should not vary • Overdriving headlights at speeds > 50 mph (except to illuminated or retroreflective items) • Continuous lighting? • Nighttime limits? • Overtaking slower moving vehicles
Ramp Criteria • Ramp design speed • Grade and profiles • Cross section and cross slope • Distance between successive ramps • Lane and shoulder widths • Acceleration and deceleration lengths
Ramp Lane and Shoulder Widths • Vehicle breakdown potential on the longer ramps • Same values for truck, passenger car, or mixed-use facilities
Roadside • Clear zone • Median barrier • Slopes and ditches • Crash testing guidelines • Hardware assessment