Download
1 / 55
560 likes | 1.28k Views
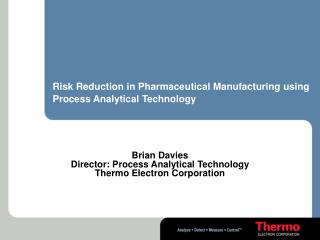
Risk Reduction in Pharmaceutical Manufacturing using Process Analytical Technology. Brian Davies Director: Process Analytical Technology Thermo Electron Corporation. A Definition of Risk. Exposure to: Gain or Loss Usually understood as exposure to Loss

E N D
Risk Reduction in Pharmaceutical Manufacturing using Process Analytical Technology Brian Davies Director: Process Analytical Technology Thermo Electron Corporation
A Definition of Risk • Exposure to: • Gain • or Loss • Usually understood as exposure to Loss • It’s about the potential unknown outcomes of events
Classically Risk in quantified in terms of: • Impact • What will happen if this exposure occurs? • Probability • What is the likelihood of the exposure? • Detectability • Is the exposure easily detected?
Classic Risk mitigation strategy • Quantify the risks • Pareto the risks • Establish countermeasures and mitigation routes to: • Minimise • Impact • Probability • Maximise • Detectability
Pharmaceutical Quality Risk • Bad Quality • To patient • To Good Quality • Financial risk • Raised expectations
Pharmaceutical Financial Risk • Scrap • COPQ • Disposal costs • Environmental Impact • Wasted resources • Inventory tied up • Raw Materials • WIP • Finished goods • Capacity lost • Cycle time up • Recalls • Brand
Pharmaceutical Regulatory Risk • More scrutiny from the regulators • Today’s products • New products undergoing licensing • Tomorrow’s products
Risk and the Pharma manufacturing value chain • Most Pharma manufacturing processes: • Take relatively low value raw materials from suppliers • Add value during formulation • Add value during finishing • Add value during packaging • Add value during distribution • Each stage has its own associated risks • Each stage has its own mitigation strategies • Classical approach • Measure ‘quality’ of raw materials • Measure ‘quality’ of finished goods
Definition of PAT • PAT is a system for designing, analyzing, and controlling manufacturing through timely measurements (i.e., during processing) of critical quality and performance attributes of raw and in-process materials and processes with the goal of ensuring final product quality
Off line testing of product quality – Policing function On-line monitoring/control of critical process parameters - Control function Assess conformance Control as appropriate
One Role of PAT • Obtaining improved process knowledge in order to identify and remove sources of variability and hence achieve RFT performance
Benefits of Right First Time • Assures product QUALITY • Enhances SUPPLY reliability • Improves COST • Reduces INVENTORY • Reduces CYCLE TIME • Improves CAPACITY UTILIZATION • Increases JOB SATISFACTION • transforms the organization from a REACTIVE through PROACTIVE to being PREDICTIVE Enhances Strategic Effectiveness of Manufacturing
Inputs to the process control variability of the output Sources of Variability People I N P U T S (x) y = f(x) Equipment y Measurement Process Output Materials Variability - source of the big risks to the product Environment
Use of PAT to Reduce Variation • Monitor variation throughout process • Raw materials • In-process parameters • Finished product parameters • Determine what is Critical to Quality (CTQ) • Correlation to performance (statistics) • Designed experiments • Use PAT to remove/control unwanted variation in CTQ parameters • Mitigate the risk of the process to product quality
Off line testing of product quality – Policing function On-line monitoring/control of critical process parameters - Control function Assess conformance Control as appropriate
Risk – Raw Materials • Correct Material? • Correct Specification? • Purity • Water content • Etc. • Manufacturability? • Chemical • Physical properties
Qualitative Analysis Application - Raw Material ID • Pharmaceutical users want to apply NIR to inspect incoming raw materials quickly at the loading dock. • They often would like to equip the receiving area with an NIR to be used by technicians who are not trained as scientists. • The instrument will be used to confirm the identity of each container of material that is received. This would otherwise have to be done in the QC lab by wet chemical techniques.
Library Samples • One lot each of the following substances was provided for the construction of the raw material library D-Glucose D-Fructose Sucrose D-Mannitol D-Sorbitol -D-Lactose Monohydrate Acetylsalicylic Acid Acetaminophen L-Ascorbic Acid Citric Acid
Qualitative Analysis to Protect Your Processes • Your process has changed without explanation and is offline until the problem is resolved • Find that one raw material supplier has recently changed • Did supplier B send the same material that Supplier A did? • Qualitative FT-NIR analysis will show chemical differences between two different lots of, for example, HPMC, a common industrial raw material.
Qualitative Analysis Can Differentiate Subtle Differences in Physical Properties • Different physical properties in batches of the same chemical compound can affect reaction parameters like dissolution or reaction rate • Particle size, crystal geometry or packing, hydration • Your process has been set up to use only 50 micron Microcrystalline Cellulose • Spectral information alone will show the same chemical Qualitative Analysis can show particle sizes
Risk – Blended Materials • During formulation the API and excipients are dispensed then blended into a homogenous mixture.
Blend Uniformity in Tablets • Achieving proper blend uniformity for tablets prior to pressing is critical to achieve proper distribution of actives and excipients. • Under-blending results in inhomogeneous distribution of active ingredients in tablet • Over-blending leads to unrecoverable material • Example shows how blend uniformity can be successfully monitored in seconds using FT-NIR technology
Region of Interest for Component #2 Component #1 Component #2
FT-NIR Predictions for Blending Sample ID% Component #1% Component #2 Sample 1 Top 47.6 51.2 Sample 1 Middle 47.9 51.0 Sample 1Bottom 48.0 50.8 Sample 2a Top 53.4 45.5 Sample 2a Middle 49.2 49.6 Sample 2a Bottom 53.7 45.2 Sample 2b Top 52.3 46.6 Sample 2b Middle 48.8 50.2 Sample 2b Bottom 50.6 48.3
Show Concentration Differences in Tablets • Can use both Transmission and Reflection measurements to analyze tablets. Can be done without removing the tablets from the Antaris • Distinguish different clinical tablet formulations by amount of active ingredient • Finished product is a tablet and manufacturing protocols need independent verification of amount of active ingredient.
Reflectance Spectra for Clinical Tablets 0.75 0.65 Log(1/R) 0.55 0.45 0.35 0.25 9000 8000 7000 6000 5000 1.4 1.0 0.6 0.2 Log(1/R) -0.2 -0.6 Expanded Second Derivative -1.0 -1.4 -1.8 -2.2 6000 5900 5800 5700 5600 5500 5400 Wavenumbers (cm-1)
Tablet Reflectance Results 30 R = 0.99742 RMSEC = 0.606 20 NIR Calculated (Rel. Units) 10 Calibration Validation 0 0 10 20 30 Label Claim (Rel. Units)
Tablet Transmittance Results 30 20 R = 0.99965 RMSEC = 0.0561 NIR Calculated (Rel. Units) 10 Calibration Validation 0 0 10 20 30 Label Claim (Rel. Units)
Tablet Transmission Data Classification Using Discriminant Analysis 0 1 2 PC3 4 12 16 24 PC1
Effective Risk reduction using PAT • PAT is not just about measurement • It’s a whole lot more • Requires a toolbox of PAT sensors • NIR • Mid-IR • Raman • Fluorescence • Acoustic • Thermal • And many more! • Process and system integration • Process modelling • Informatics and Knowledge Management • 24/7/365 Global Support for mission critical implementations
Summary: How PAT will reduce Risk • True Process Knowledge. • Raw Materials • Work in progress • Finished product • Designed in quality measurement systems • Future Pharma products will have PAT in the licencing applications • Right 1st Time for current Pharma products. • Real time or near-real time product quality monitoring. • Feed back and feed forward process control. • Integrated systems for risk reduction via knowledge acquisition and management.
Reaction monitoring Blending and mixing Fermentation Drying Measurements across the process Process Monitoring (PAT)
Desired State • Product quality and performance achieved and assured by design of effective and efficient manufacturing processes • Product specifications based on mechanisticunderstanding of how formulation and process factors impact product performance • Continuous "real time" assurance of quality http://www.fda.gov/cder/gmp/21stcenturysummary.htm