Evaluating Hypotheses
Learn about the differences between descriptive and inferential statistics in evaluating hypotheses, including hypothesis testing and hypothesis evaluation steps.

Evaluating Hypotheses
E N D
Presentation Transcript
Evaluating Hypotheses Chapter 9 Homework: 1-9
Descriptive vs. Inferential Statistics • Descriptive • quantitative descriptions of characteristics ~
Inferential Statistics • Making conclusions (inferences) about parameters • e.g., m»X • confidence intervals: infer m lies within interval • also quantitative ~
Hypothesis Testing • Most widely used inferential statistics • Hypothesis • testable assumption or inference • about a parameter or distribution • should conclusion (inference) be accepted? • final result a decision: YES or NO • qualitative not quantitative ~
Hypothesis Testing • Example: IQ scores • m = 100, s = 15 • Take random sample of students • n = 10 • Hypothesis: • sample is consistent with population with above parameters • sample is the same as population ~
Proving / Disproving Hypotheses • Logic of science built on disproving • easier than proving • but ultimately want to prove • State 2 mutually exclusive hypotheses • if one is true, other cannot be true ~
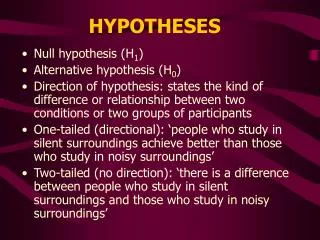
Hypothesis Evaluation • Null Hypothesis: H0 • there is no difference between groups • Alternative Hypothesis: H1 • also called “experimental” hypothesis • there is a difference between groups ~
Steps in Hypothesis Evaluation 1. State null & alternative hypotheses • H0 and H1 2. Set criterion for rejecting H0 • level of significance: a 3. collect sample; compute sample statistic & test statistic 4. Interpret results • is outcome statistically significant? ~
Hypothesis Evaluation • Example: IQ and electric fields • question: Does living near power lines affect IQ of children? • H0 : there is no difference • Living near power lines does not alter IQ. • m = 100 • H1 : Living near power lines does alter IQ. • m¹ 100 ~
Hypothesis Evaluation • Outcome of study • reject or “accept” null hypothesis • Reject Ho • accept as H1 true • “Accepting” null hypothesis • difficult or impossible to “prove” Ho • actually: fail to reject Ho • i.e., data are inconclusive ~
Evaluating Ho and H1 • Hypotheses about population parameters • Test statistic • especially designed to test Ho • Procedure depends on… • particular test statistic used • directionality of hypotheses • level of significance ~
Directionality & Hypotheses • Directionality affects critical values used • Nondirectional • two-tailed test • Ho : m = 100; H1 :m¹ 100 • change could be either direction • Do not know what effect will be • may increase or decrease IQ ~
Directionality & Hypotheses • Directional • one tailed test • Have prior evidence that suggests direction of effect • predict that effect will be larger • or smaller, but only 1 • Ho: m< 100 • H1: m > 100 ~
Errors • “Accept” or reject Ho • only probability we made correct decision • also probability made wrong decision • Type I error • incorrectly rejecting Ho • e.g., may think a new antidepressant is effective, when it is NOT ~
Errors • Type II error • incorrectly “accepting” Ho • e.g., may think a new antidepressant is not effective, when it really is • Do not know if we make error • because we do not know true population parameters ~
H0 is true H0 is false Accept H0 Reject H0 Errors Actual state of nature Type II Error Correct Decision Type I Error Correct
Level of Significance (a) • Probability of making Type I error • complement of level of confidence • .95 + .05 = 1 • a = .05 • conduct experiment 100 times • 5 times will make Type I error • Want probability of Type I error small ~
Statistical Significance • If reject H0 • Outcome is “statistically significant” • difference between groups is ... greater than expected by chance alone • due to sampling, etc. • Does NOT say it is meaningful ~
Statistical Power • Power • probability of correctly rejecting H0 • b = probability of Type II error • complement of power • *power = 1 - b ~
Practical Significance • Degree to which result is important • result can be statistically significant • but not important in real world • Effect size • measure of magnitude of result • difference between means of 2 groups • e.g., IQ: 1 point small effect, 15 large ~
Procedure for Evaluating Hypotheses • Experiment • Draw random sample • compute statistic • determine if reasonably comes from population • If no, reject H0 • Use test statistic to make decision • 3 important distributions variable, sample statistic, test statistic~
Test Statistic • distribution of test statistic • has known probabilities • General form • test statistic = sample statistic - population parameter • standard error of sample statistic • difference actually obtained: X - m • divided by difference by chance alone ~
Steps in Hypothesis Evaluation 1. State null & alternative hypotheses • H0 and H1 2. Set criterion for rejecting H0 • level of significance: a 3. collect sample; compute sample statistic & test statistic 4. Interpret results • is outcome statistically significant? • *If so, is it practically significant? ~